
Last updated: 2026-04-25
The Short Answer
Repeat incident prevention is the practice of identifying, analyzing, and eliminating the underlying conditions that cause the same type of safety event to occur multiple times. Effective prevention combines pattern detection across incidents, root cause analysis at scale, targeted corrective actions, and validation that changes actually work — transforming safety programs from reactive firefighting into systematic cycle-breaking operations.
Introduction: The Frustration of Seeing the Same Incident Type Again and Again
You close out an investigation. Corrective actions are documented. The report is filed. You move on.
Three weeks later, it happens again. Same location. Same failure mode. Same injury type.
If you are a Safety Director, EHS Manager, or Operations Leader, this is painfully familiar. Recurring safety incidents are one of the most demoralizing challenges in industrial safety — not because teams aren't working hard, but because the systems they rely on were never designed to catch patterns across time.
Most organizations respond well to individual incidents. They struggle to recognize that those incidents are part of a repeating pattern. Without pattern recognition, there is no repeat incident prevention.
This guide explains why safety incidents repeat, why traditional reporting misses the connections, and how a systematic approach — grounded in detection, root cause analysis, action, training, and validation — finally breaks the cycle.
Why Do Safety Incidents Repeat? 5 Root Causes
Recurring safety incidents rarely stem from a single failure. Multiple reinforcing factors create conditions where the same event type keeps occurring.
| Root Cause | What It Looks Like | Why It Persists |
|---|---|---|
| Incomplete Root Cause Analysis | Investigations stop at immediate causes without exploring system-level contributors | Time pressure and checkbox compliance culture |
| Weak Corrective Action Tracking | Actions are assigned but never verified for completion or effectiveness | Spreadsheets make follow-up invisible |
| Siloed Incident Data | Similar events at different shifts or sites are never compared | No central system connects incidents across time and location |
| Generic Training | Off-the-shelf safety training with no reference to actual site incidents | Training content is not tied to real recurring events |
| Lagging Indicators Only | Reliance on TRIR and LTIFR that confirm problems after repetition | Lagging metrics cannot flag emerging repeat patterns |
Source: illustrative example based on common EHS management patterns
When investigations are shallow, real conditions persist. When data is siloed, no one sees the pattern. When training is generic, workers encounter the same hazards with the same awareness gaps. The result is a cycle traditional approaches struggle to break.
The Repeat Incident Detection Problem: Why Traditional Reporting Misses Patterns
Most organizations collect incident data. The problem is not a lack of information — it is a lack of pattern intelligence.
Traditional incident reporting systems are designed for documentation and compliance. They are not designed to answer harder questions: Has this same failure mode occurred before? Are similar events happening across shifts? Did our last corrective action actually change the outcome?
Narrative-Based Storage. Finding connections requires someone to read hundreds of reports and mentally identify similarities — a task rarely performed consistently.
Inconsistent Classification. One investigator codes an event as "slip and fall." Another codes an identical event as "poor housekeeping." Without normalized classification, the system cannot group related events automatically.
No Cross-Temporal Analysis. Even digital EHS platforms rarely surface temporal patterns. A repeat incident six months after the original may never be connected because no one is systematically looking backward.
Repeat incident patterns remain invisible until they become severe enough to trigger management attention — by which point multiple workers have already been exposed to preventable risk events.
Ready to see what your current system is missing? SAFVR's predictive safety intelligence surfaces leading indicators and repeat patterns by correlating data across sites, shifts, and time. Start a 30-day pilot and detect patterns before the next incident occurs.
How AI Identifies Repeat Incident Patterns: Cross-Referencing Events Across Time and Location
Modern Safety Intelligence Platforms detect repeat incident patterns that human reviewers and traditional software miss.
Temporal Clustering. AI analyzes incident timestamps to identify events at unusual frequencies. If a near-miss typically happens once per quarter but has occurred three times in six weeks, the system flags an emerging pattern — even across different shifts and supervisors.
Spatial Correlation. When computer vision is integrated with facility maps and camera locations, the system identifies whether incidents cluster around specific equipment, walkways, or workstations. Locations generating repeated unsafe acts & conditions become visible as hotspots.
Failure Mode Matching. AI normalizes events by underlying characteristics — hazard type, action sequence, environmental conditions, and protective failures. This groups incidents that share the same causal structure even when human descriptions differ.
Corrective Action Effectiveness Tracking. The system monitors whether incident frequency changes after corrective actions. If events continue at the same rate, the action is flagged for re-evaluation — closing the loop traditional systems leave open.
Source: illustrative example based on AI-enabled safety intelligence methodology
These capabilities transform incident data from a compliance archive into a live diagnostic tool. Safety teams stop guessing whether patterns exist and start seeing them clearly, with timestamps, locations, and trend lines that make the case for action unmistakable.
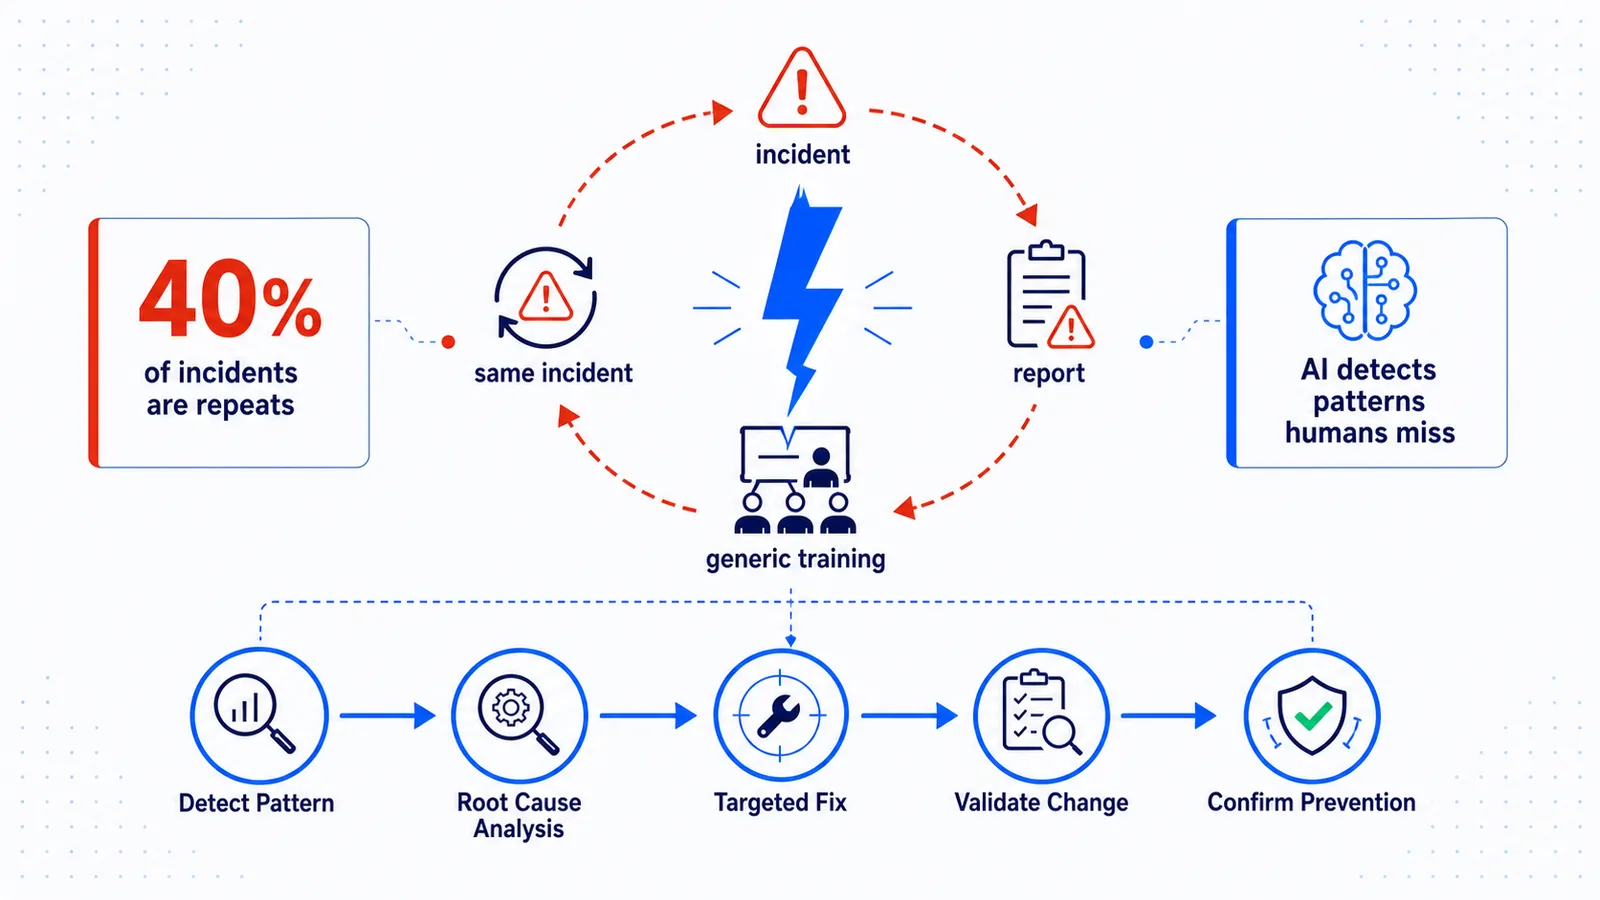
The 5-Layer Prevention Framework: Detection → Root Cause → Action → Training → Validation
Breaking the cycle requires an integrated framework where each layer feeds the next.
Layer 1: Detection. Real-time detection of hazards, unsafe acts & conditions, and near-misses via computer vision and structured reporting. If you cannot detect incidents consistently, you cannot detect repetition.
Layer 2: Root Cause Analysis. Structured analysis identifies system-level conditions — equipment design, procedure gaps, environmental factors, training deficiencies — that allowed each event to occur.
Layer 3: Corrective Action. Root causes drive specific, accountable actions with owners and deadlines, tracked in the same system that detected the incident.
Layer 4: Targeted Training. Site-specific micro-training is generated for affected workers — not generic content, but modules based on actual events at their facility.
Layer 5: Validation. The system monitors whether the pattern stops after actions and training are deployed. Validation is the layer most often missing from traditional safety programs.
Source: SAFVR AURA platform methodology
This framework is the operational architecture behind SAFVR's AURA (Autonomous Unified Recognition & Action) Engine — an adaptive safety intelligence platform — which runs a continuous loop of AI hazard detection, safety compliance automation, incident-based micro-training, and predictive safety intelligence — all within a single connected platform.
Root Cause Analysis at Scale: From Individual RCA to Pattern-Based Analysis
Traditional root cause analysis treats each incident as isolated. Pattern-based analysis treats repeat incidents as symptoms of a systemic condition.
Consider repeated forklift-pedestrian near-misses in one warehouse aisle. Individual RCAs might blame the pedestrian, the forklift speed, or poor visibility. But no single RCA reveals the systemic issue: the designated walkway is poorly positioned, creating a recurring conflict point. Pattern-based analysis surfaces this by asking what events share, not what makes them different.
A Safety Intelligence Platform enables scaled analysis by automatically grouping incidents with shared failure modes, surfacing common contributing factors, identifying root causes across multiple locations, and tracking whether corrective actions at one location prevent recurrence at others.
Source: illustrative example based on industrial safety pattern analysis methodology
This shifts the focus from investigating individual events to addressing conditions that generate entire categories of preventable risk events — fewer investigations, deeper insights, more durable prevention.
Training as a Prevention Tool: How Targeted Micro-Training Breaks Cycles
Generic safety training has a documented limitation: workers struggle to connect broad content to daily tasks. When training is disconnected from actual site events, it becomes a compliance exercise rather than a behavior-shaping tool.
Micro-training delivers short, targeted content — typically 3 to 5 minutes — focused on a hazard or failure mode that actually occurred at the worker's location. The connection to real events creates relevance, and relevance drives retention.
When a pattern is detected, the platform identifies the failure mode, generates training addressing those exact conditions, delivers it to affected workers, tracks completion, and monitors whether incident frequency changes.
SAFVR's incident-based micro-training is designed for this closed-loop approach, generating site-specific content from actual camera-detected and reported events. For multilingual workforces, delivery in the worker's primary language further increases comprehension — essential when the goal is genuine behavior change, not just completion records.
Source: SAFVR platform capability description
Measuring Repeat Incident Reduction: KPIs and Timeframes
Preventing repeat incidents is measurable. The key is selecting metrics that track pattern interruption, not just overall incident counts.
| KPI | What It Measures | Frequency | Target Benchmark |
|---|---|---|---|
| Repeat Incident Rate | % of incidents matching a prior event's failure mode within 12 months | Monthly | <10% (illustrative example) |
| Time-to-Pattern-Detection | Days between first and second event in a repeat pattern | Per pattern | <7 days |
| Corrective Action Closure Rate | % of actions closed by assigned deadline | Monthly | >90% |
| Post-Action Incident Reduction | Change in incident frequency where corrective actions were implemented | 30/60/90 days | >50% reduction at 90 days (illustrative example) |
| Training-to-Event Relevance Score | % of training modules directly linked to detected site incidents | Quarterly | >80% |
| Leading Indicator Coverage | Hazard types and locations under active pattern monitoring | Monthly | 100% of high-risk areas |
Source: illustrative example based on EHS performance measurement frameworks
Timeframes for meaningful measurement:
- 30 days: Early indicator of action completion and training deployment
- 90 days: Sufficient data to detect whether frequency is declining at treated locations
- 12 months: Full cycle for assessing whether patterns have been durably broken
Measure at the pattern level, not just the facility level. A facility-wide TRIR improvement can mask ongoing repetition in one department while another improves. Pattern-level metrics reveal where the cycle is actually breaking.
Frequently Asked Questions
What is the difference between a repeat incident and a similar incident?
A repeat incident shares the same root cause or failure mode as a prior event, meaning the underlying condition was not effectively addressed. A similar incident may look alike on the surface but stems from a different cause. Distinguishing between the two requires consistent root cause analysis — which is why AI-enabled pattern detection is valuable.
How long should organizations monitor for repeat incidents after a corrective action?
Industry practice suggests monitoring for at least 90 days to assess initial effectiveness, with continued tracking for 12 months to confirm durable prevention. High-frequency events can be evaluated more quickly; low-frequency events require longer observation.
Can small facilities with limited incident volume implement repeat incident prevention?
Yes. Even facilities with low incident counts benefit because rare events are often the most severe. A Safety Intelligence Platform can aggregate anonymized pattern data across similar facility types for benchmarks, while site-specific detection ensures every event is captured.
What role do workers play in repeat incident prevention?
Workers are critical data sources. The fastest way to detect an emerging repeat pattern is to make incident and near-miss reporting frictionless. When workers see that reporting leads to visible action — corrected conditions, targeted training, equipment fixes — reporting rates increase and the organization gains earlier visibility into recurring conditions.
How does AI improve on traditional trend analysis for incident prevention?
Traditional trend analysis relies on manual data aggregation and human pattern recognition, which misses subtle connections across locations, shifts, and time periods. AI improves detection by automatically normalizing classifications, correlating spatial and temporal data, and surfacing patterns below the threshold of human notice.
Conclusion: From Reactive Reporting to Proactive Protection
Repeat incident prevention is not about working harder. It is about working with better visibility.
Safety professionals already know how to investigate incidents, assign corrective actions, and deliver training. What they have lacked is a system that connects these activities into a continuous, intelligent loop — one that detects patterns, analyzes them at scale, triggers the right responses, and validates that those responses work.
When that loop is in place, the frustration of seeing the same incident type again and again gives way to confidence that the organization is systematically eliminating the conditions that create them.
That shift — from reactive reporting to proactive protection — is what separates organizations that manage safety from organizations that master it.
Take the Next Step
Start a 30-day safety intelligence pilot to see how the AURA Engine detects repeat incident patterns across your facility and gives your team the visibility to break the cycle. Or explore the full platform to learn how detection, action, improvement, and prevention work together in a single connected system.
Related Reading
- Near-Miss Trend Analysis Guide — Near-misses are the early warning system for repeat incidents — here’s how to systematize their analysis.
- Leading vs. Lagging Indicators in Safety — Why tracking leading indicators is the key to breaking the repeat incident cycle.
- Predictive Risk Scoring for Workplace Safety — How adaptive risk scoring identifies zones and shifts where repeat incidents are most likely.