
Safety Intelligence for Smarter Underwriting.
Continuous site-level risk data, automated compliance scoring, verified training completion, and predictive loss indicators — transforming underwriting from snapshot to signal.
Insurance underwriting relies on self-reported safety data, periodic site visits, and historical loss ratios. SAFVR replaces opacity with intelligence — providing continuous, verified, site-level safety data that underwriters can use to assess risk, price policies, validate compliance, and predict which sites in a portfolio are accumulating risk before claims materialize.
What Insurers Safety Leaders Face Today.
- 01
Opaque Risk Data
Underwriting decisions based on self-reported safety data from policyholders — unverified, infrequent, and optimistically biased toward compliance.
- 02
Snapshot Assessments
Annual or semi-annual site visits that capture a single moment in time, missing the day-to-day reality of safety compliance, near-miss frequency, and training gaps.
- 03
Claims Prediction Ceiling
Historical loss ratios predict the past, not the future. Limited ability to forecast which sites in a portfolio will generate the next cluster of claims.
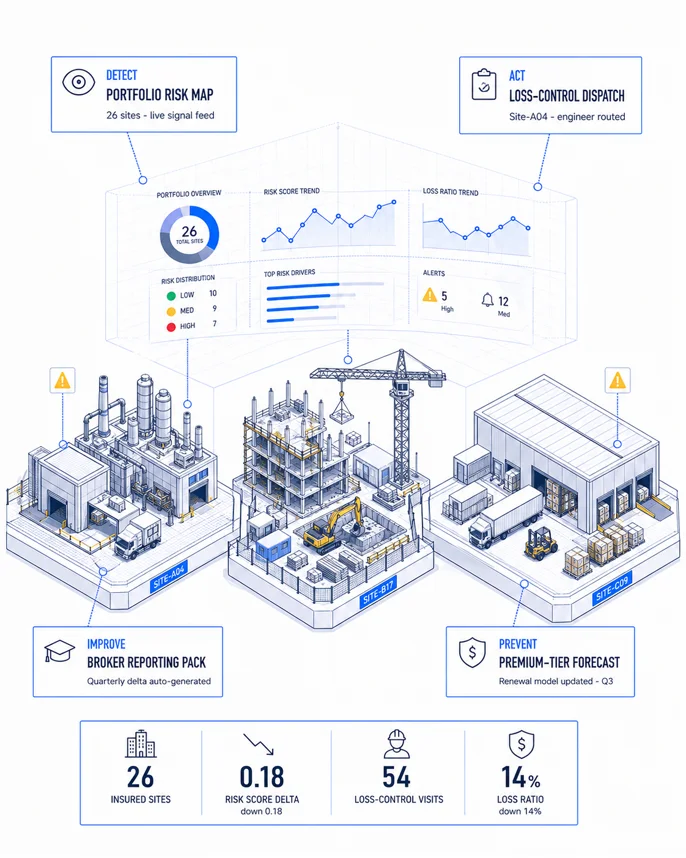
Detect. Act. Improve. Prevent.
- 01 / DETECT
Continuous Site Risk Feeds
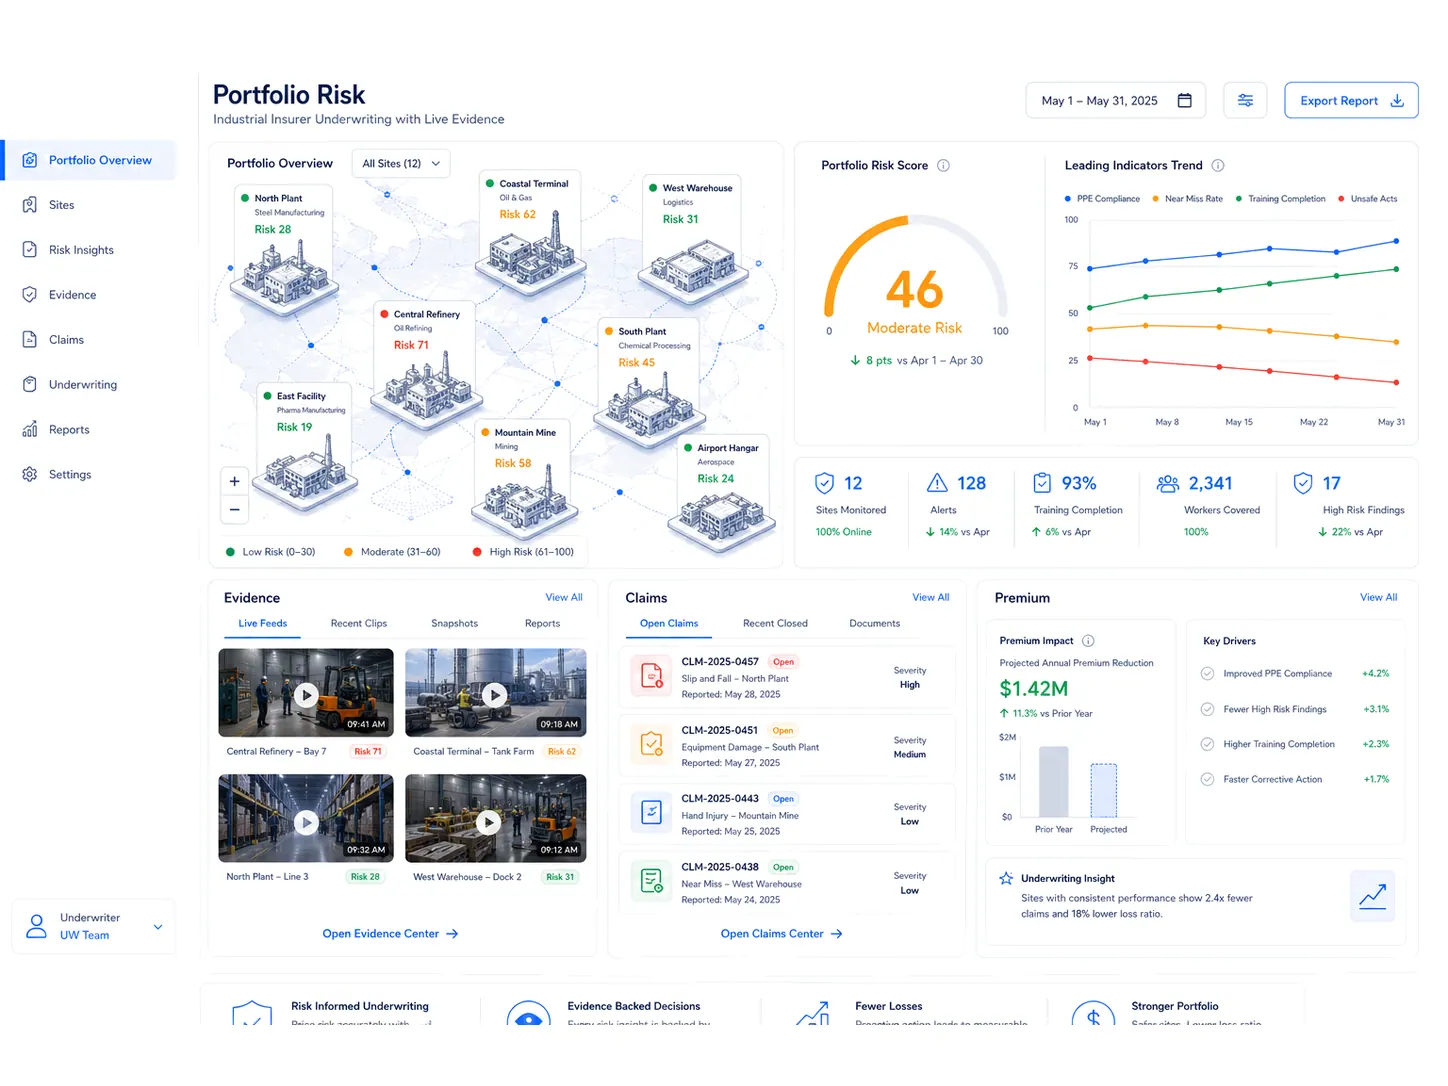
Real-time, verified safety data from policyholder sites — including hazard detection rates, near-miss frequency, and zone violation patterns — replacing self-reported snapshots with continuous signal.
Inside DETECT - 02 / ACT
Automated Compliance Scoring
Portfolio-level compliance scoring that updates continuously — flagging sites where safety performance is deteriorating, compliance gaps are widening, or corrective actions are overdue.
Inside ACT - 03 / IMPROVE
Verified Safety Improvement Tracking
Track policyholder safety improvements with verified data — training completion rates, incident reduction trends, and corrective action close-out velocity tied to policy periods.
Inside IMPROVE - 04 / PREVENT
Predictive Loss Forecasting
AURA's leading indicator intelligence correlates detection patterns, compliance scores, and training data across a portfolio — forecasting which sites are accumulating risk and which are improving, before claims data tells the story.
Inside PREVENT
What Insurers Pilots Measure.
Outcomes vary by camera coverage, baseline maturity, and workforce mix. Pilot results are measured per site over the 30-day deployment window.
Every System. Every Zone. One Platform.
Continuous Risk Monitoring
Real-time safety performance data from every policyholder site — replacing annual snapshots with continuous, camera-verified leading indicators that reflect actual site-level risk posture.
Predictive Loss Modelling
AURA correlates detection patterns, compliance scores, and corrective-action velocity across a portfolio to forecast which sites are accumulating loss-likely risk — enabling proactive loss control.
Safety Compliance Scoring
A composite score reflecting PPE compliance, incident response time, training completion, and corrective-action closure rate — updated continuously and benchmarked against portfolio averages.
Policyholder Safety Verification
Camera-verified evidence of safety program performance — not self-reported checklists. Underwriters see what's actually happening on site, not what the insured claims is happening.
Workers Comp Analytics
Leading indicators — detection rates, near-miss trends, training compliance — fed into workers' compensation underwriting models to support loss-control credit decisions and renewal pricing.
Loss Control Engineering
AI-powered site assessments replace manual loss-control visits. AURA surfaces the specific risks, zones, and shifts driving claims — enabling engineers to focus interventions where ROI is highest.
Common questions about SAFVR for insurers.
- How does SAFVR support insurance underwriting?
- SAFVR provides continuous, verified, site-level safety data from policyholder operations — detection rates, compliance scores, training completion, and corrective-action velocity — designed to support underwriting decisions, premium calibration, and portfolio risk reviews.
- Can SAFVR replace annual loss-control site visits?
- SAFVR augments rather than replaces site visits. Continuous site-level data fills the gap between visits, surfacing emerging risk and verified improvement so on-site assessments focus on high-priority cases.
- How is data shared between policyholders and underwriters?
- Data sharing is governed by explicit policyholder consent and configurable scopes — typically aggregate compliance scores, leading-indicator trends, and verified improvement metrics, never raw video. Privacy and contractual boundaries are enforced by the platform.
- What does predictive loss forecasting actually predict?
- AURA correlates detection patterns, compliance scoring, training completion, and corrective-action velocity across a portfolio to forecast which sites are accumulating loss-likely risk — surfaced as portfolio-level leading indicators, not point-in-time scores.
- Is this designed to support workers' compensation underwriting?
- Yes. Verified safety performance data — incident reduction trends, training completion, and leading indicators — is designed to support workers' compensation underwriting, loss-control credit decisions, and portfolio risk improvement reporting.
- Can SAFVR data feed into actuarial risk models?
- Yes. SAFVR is designed to support data export via standard APIs — enabling actuarial teams to incorporate continuous, site-level leading indicators such as detection rates, compliance scores, and corrective-action velocity into existing risk models and loss-forecasting frameworks.
Inside the Loop & Adjacent Industries.
Underwrite With Intelligence, Not Intuition
See how SAFVR provides the continuous, verified safety intelligence your underwriting team needs. Schedule a demo tailored to your portfolio.