
Find risk before incidents start.
Leading indicators, not lagging reports.
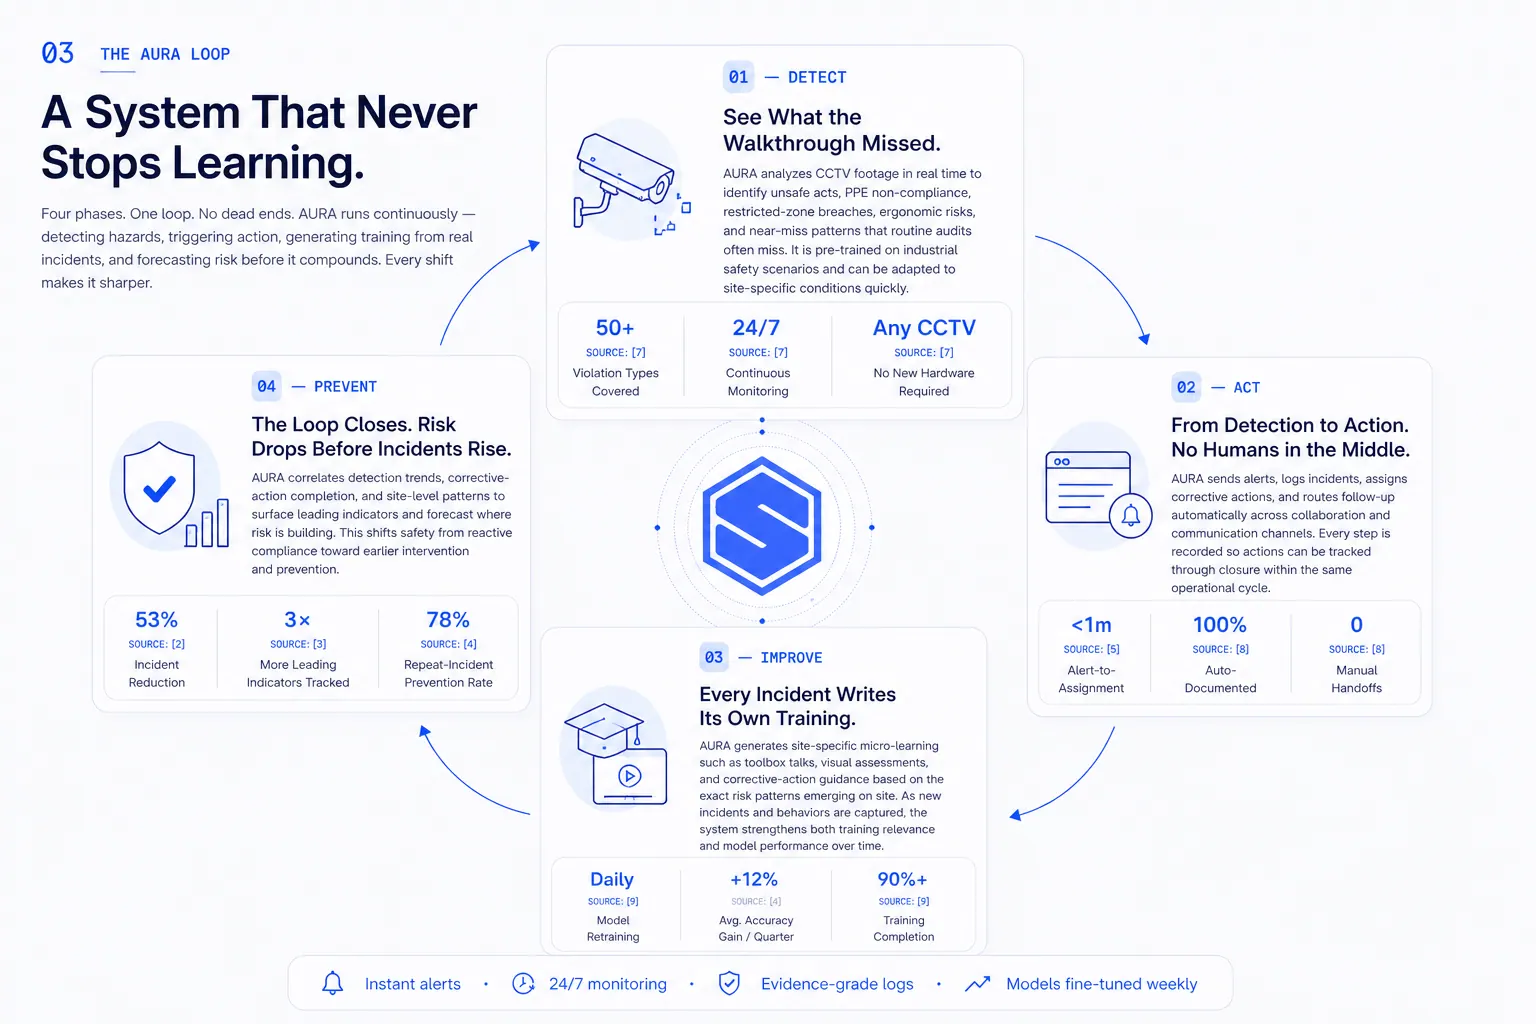
Prevent is the predictive layer of the AURA (Autonomous Unified Recognition & Action) Engine — an adaptive safety intelligence platform. It correlates detection patterns, action close-out velocity, training completion, and repeat-hazard clusters into forward-looking risk scores by zone, shift, and crew.
What are leading indicators in safety?
Leading indicators are measurable signals that show risk building before an incident occurs — near-miss frequency, unsafe-condition trends, corrective-action close-out velocity, repeat hazard locations, training gaps, and shift-level behavior patterns.
SAFVR — the Safety Intelligence Platform — turns those signals into predictive intelligence. Prevent correlates them across sites, shifts, and crews so safety leaders can intervene earlier, instead of investigating later.
Lagging indicators only react. Leading indicators reveal drift.
TRIR. LTIR. DART. Citations.
Reported weeks or months after the event. They tell you what went wrong last quarter — and nothing about the risk building right now. You can audit your way to compliance, but you can't react your way to zero.
Drift, density, velocity, repetition.
Updated every shift in real time. Near-miss frequency, unsafe-condition trend, corrective-action close-out velocity, and repeat-hazard clusters — correlated across the loop and surfaced as forward-looking risk scores.
Six engines.
One predictive layer.
Prevent does not guess. It correlates signals already flowing through the loop and turns them into the operating picture safety leaders need to intervene early.
- Spatial
Zone-level risk scoring.
Every operational zone receives a dynamic risk score from detection density, action close-out velocity, and historical incident patterns — recalculated each shift.
- Temporal
Shift drift detection.
Night shifts, handover windows, and holiday-adjacent rotations carry hidden risk. AURA correlates timing with detection volume and surfaces the drift before the pattern hardens.
- Workforce
Crew composition risk.
Risk profiles are built per role and per crew make-up. A new operator paired with a fatigued supervisor in a confined zone is not the same risk as either alone — AURA models the difference.
- Pattern
Repeat-incident clustering.
When the same hazard fires twice in two weeks despite a closed corrective action, AURA flags the intervention as failed and recommends escalation — not another close-out.
- Predictive
Predictive alert thresholds.
Forward-looking warnings when a zone, shift, or crew trends above its baseline. “Zone B forklift-proximity events 3.2× the 90-day average — recommend crew briefing.”
- Reporting
Trend rollups.
Weekly and monthly leading-indicator rollups for site, region, and enterprise — built for safety leaders, insurance reviews, and board-level reporting.
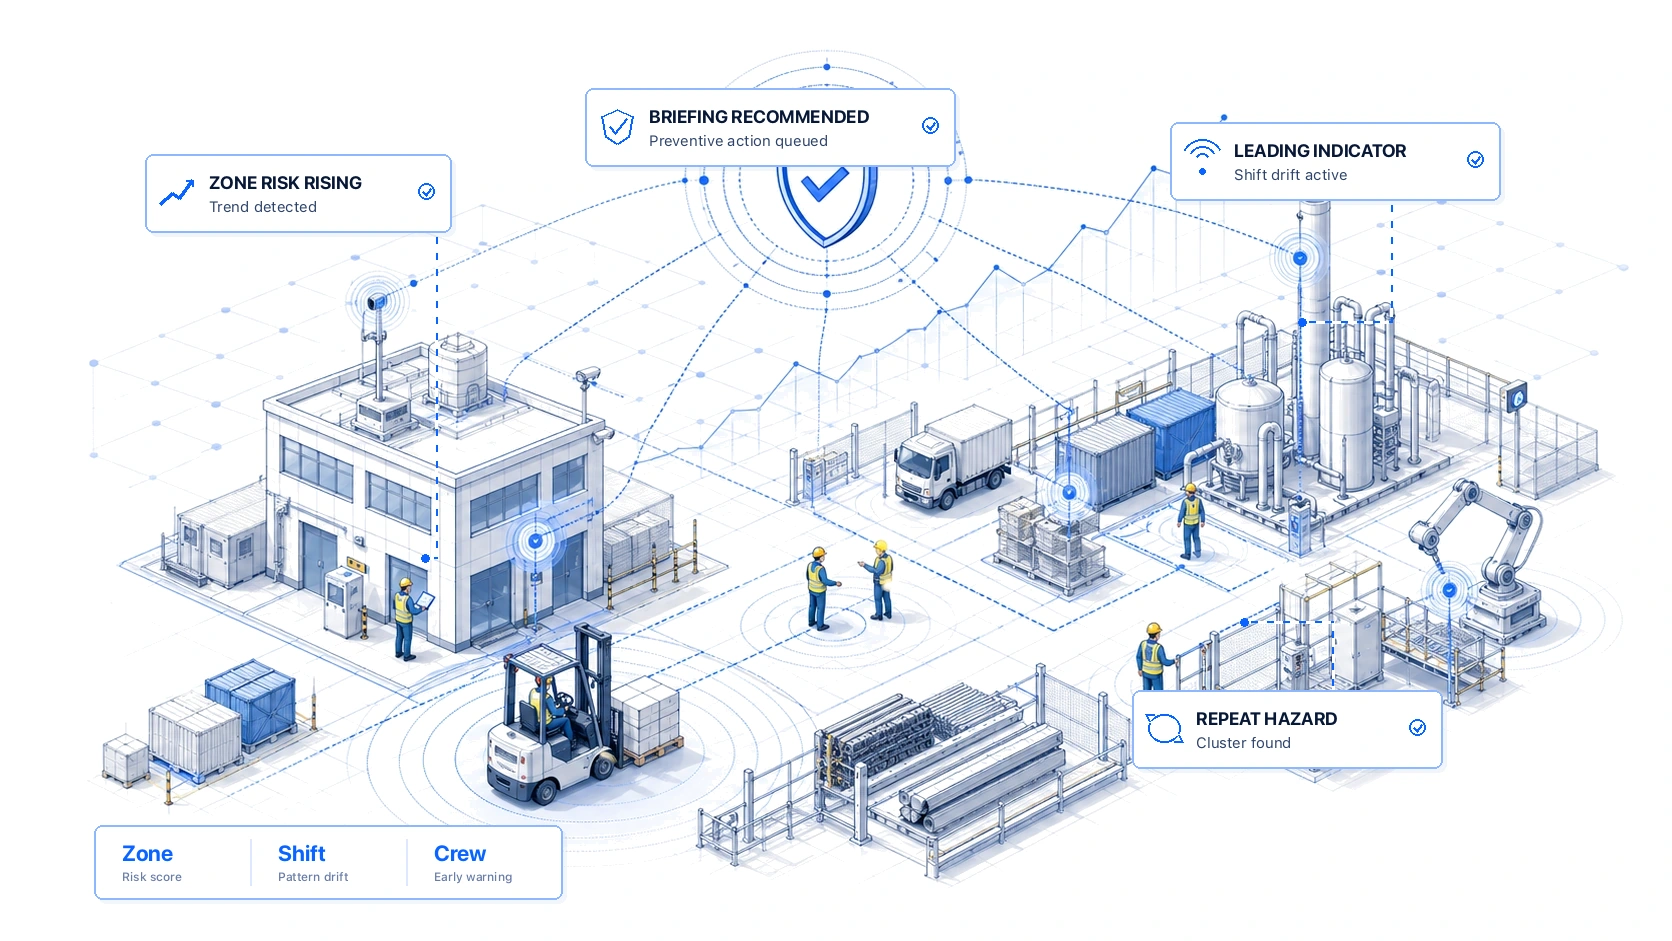
The risk grid, composited over the AURA loop.
The grid scores nine zones in parallel. When a zone drifts above baseline, the cell flips, the connector draws, and a forward-looking callout names the deviation. The reference frame underneath is the AURA loop — every cycle of Detect, Act, and Improve feeds this picture.
- Leading-indicator
- Scoring across the loop
- Zone · Shift · Crew
- Three dimensions of risk
- Repeat-incident
- Reduction by design
- 30-day pilot
- ROI methodology
Common questions about predictive safety AI.
- What is predictive safety AI?
- Predictive safety AI uses detection, action, and trend data to forecast where incidents are most likely to occur next — by zone, shift, and crew. AURA surfaces leading indicators so EHS teams can act on rising risk before it converts into an incident.
- What leading indicators does AURA track?
- Detection density per zone, corrective-action close-out velocity, repeat-precursor patterns, near-miss trends, training completion vs. incident location, and shift-over-shift drift. All are recalculated each shift and surfaced on the leading-indicator dashboard.
- Can predictive risk scoring actually reduce incidents on real sites?
- Pilot results vary by baseline maturity, camera coverage, and process discipline. SAFVR pages report customer-named or anonymized pilot outcomes with methodology and timeframes — not generic guarantees. Run a 30-day pilot to measure on your site.
- How does AURA support insurance underwriting?
- AURA generates evidence packets for underwriters: leading-indicator trend lines, repeat-incident closure rates, training completion against risk zones, and shift-level safety drift. Designed to support underwriting reviews and risk improvement reporting; does not constitute an insurance discount or guarantee.
- What data feeds the predictive models?
- Predictive scoring draws from detection events, corrective-action close-out times, repeat-hazard clusters, training completion rates, and shift-level behavior patterns — all generated by the Detect, Act, and Improve phases of the AURA loop. No external data imports are required; the model runs on signals your site is already producing.
- How often are risk scores recalculated?
- Zone, shift, and crew risk scores are recalculated at the end of every shift by default. High-severity triggers — such as a repeat precursor or a spike in detection density — can force an immediate recalculation so safety leads see updated risk before the next crew enters the zone.
READY FOR PROACTIVE PROTECTION?
Forecast where risk is building —
before incidents rise.
30 days. AURA correlates detections, corrective-action lag, and trend data to surface leading indicators by zone, shift, and crew. You move from lagging incident reports to predictive safety intelligence — with evidence underwriters and boards can read.
Leading-indicator dashboards. Underwriting-grade evidence. Board-ready trends.