
Last updated: 2026-04-25
Near-miss trend analysis is the systematic process of collecting, categorizing, and analyzing close-call events to identify recurring safety incident patterns before they result in injury or damage. By studying trends across time, location, behavior, equipment, and environmental factors, safety teams transform isolated reports into actionable leading indicators that predict and prevent future incidents.
Introduction: The Iceberg Beneath the Surface
Every serious incident sends signals beforehand. The question is whether your organization is listening.
Imagine workplace safety as an iceberg. Above the waterline sit the incidents everyone sees — injuries, property damage, regulatory citations. Below the surface stretches a massive base of unreported close calls: slips without falls, vehicle swerves without collisions, PPE lapses without exposure. Industry research shows that for every recorded injury, there are dozens — sometimes hundreds — of unreported near-misses hiding in plain sight (third-party statistic).
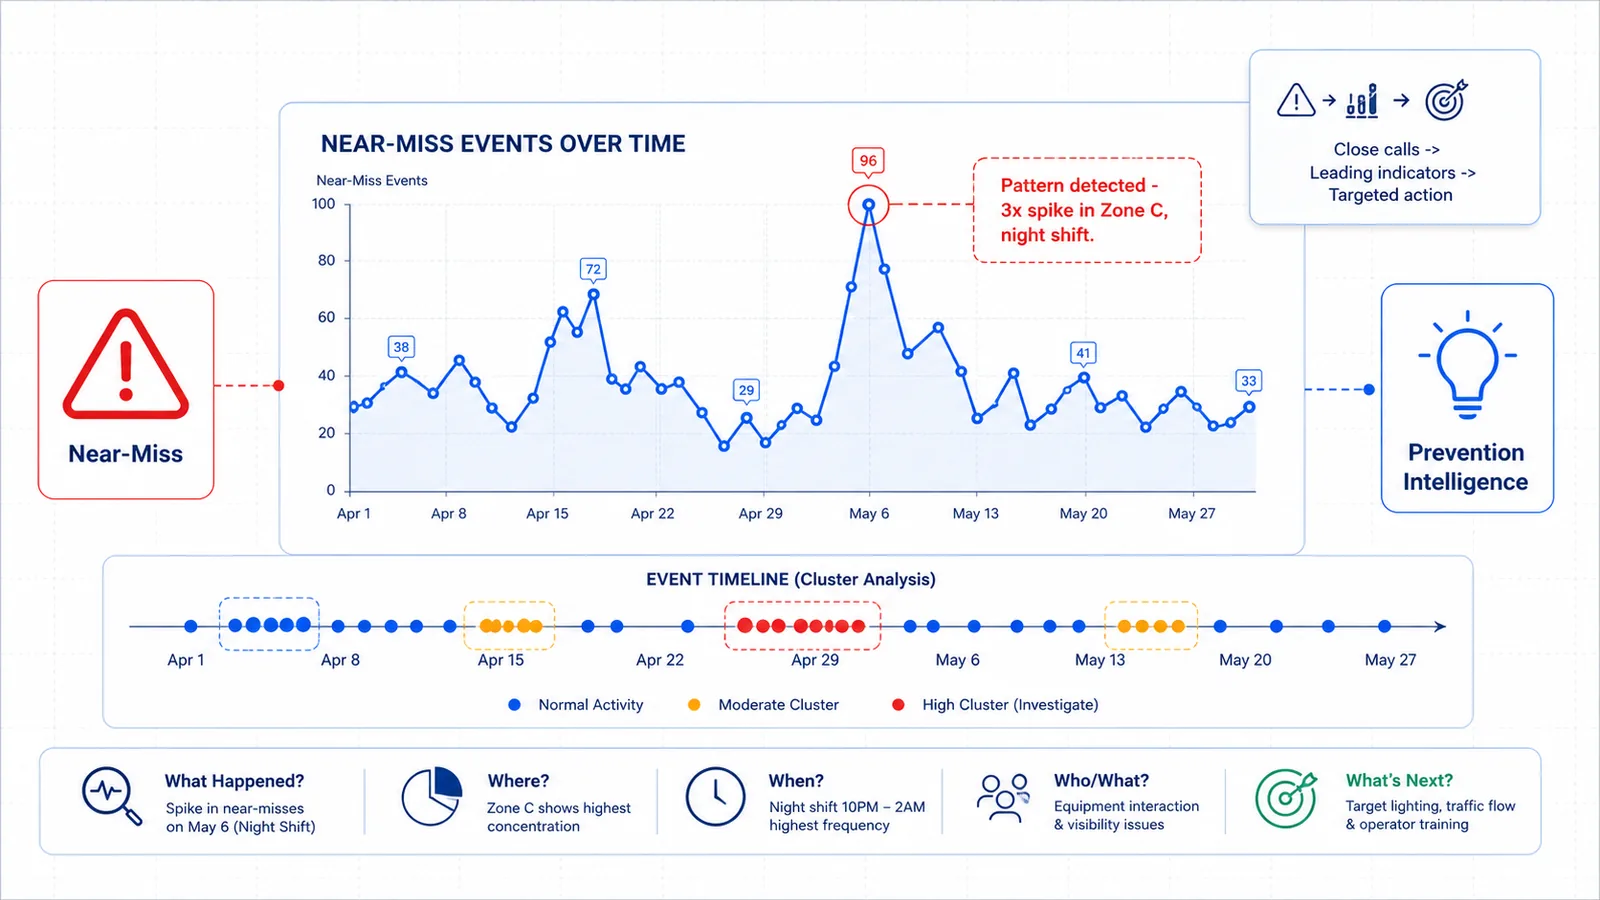
These submerged events are not noise. They are leading indicators safety programs need most. Near-miss trend analysis surfaces this hidden data, finds patterns, and converts them into prevention intelligence. The challenge? Traditional programs rely on human observation and manual reporting — creating gaps that are often enormous.
What Is Near-Miss Trend Analysis?
Near-miss trend analysis examines close-call data to detect recurring themes, correlate events with operational conditions, and generate prioritized prevention actions. Unlike single-incident investigations, which ask "What went wrong here?", trend analysis asks "What is going wrong repeatedly, and where?" It aggregates events to reveal systemic weaknesses isolated reviews cannot.
Core Components
| Component | Purpose | Example Output |
|---|---|---|
| Data Collection | Gather near-miss reports from all channels | Unified feed from manual reports, camera detections, and observation cards |
| Classification | Categorize events by type, severity, and context | "Forklift near-miss, pedestrian zone, night shift, loading bay A" |
| Temporal Analysis | Identify time-based patterns | 68% of events occur during first hour of shift (illustrative example) |
| Correlation | Link near-misses to conditions, equipment, or behavior | Spikes correlate with specific maintenance windows |
| Action Prioritization | Rank interventions by frequency and severity potential | Address highest-frequency pattern with lowest mitigation cost first |
The output is a living risk map that guides where to invest engineering controls, revise procedures, deliver targeted training, or modify workflows.
Ready to detect hazards your current system is missing? AI hazard detection with existing cameras captures unsafe acts and conditions in real time — no rip-and-replace required.
The Near-Miss Reporting Problem
If near-misses are so valuable, why do so few organizations analyze them effectively? Three interconnected failures block progress.
Underreporting. Studies estimate that 50–90% of near-misses go unreported (third-party statistic). Workers may not recognize an event as a near-miss, fear blame, or lack an easy channel. Paper forms and slow portals actively discourage participation. The result? Data that reflects not where near-misses actually happen, but where workers are most willing to report them.
Manual bottlenecks. EHS teams often lack bandwidth to process reports. A safety manager might receive dozens weekly, each requiring manual review. Reports accumulate faster than they can be analyzed, turning the process into a compliance checkbox.
Analysis gaps. Traditional EHS software stores data but does not surface correlations across shifts, weather, equipment age, or supervisors. The net effect: organizations collect near-misses, file them, and rarely learn from them at scale.
How AI Changes Near-Miss Detection
Artificial intelligence reframes near-miss detection from a self-reported activity to an automatically observed capability. It complements worker reporting with continuous, objective data capture.
From reactive to continuous: AI-powered detection uses existing IP camera infrastructure to identify near-collisions, exclusion zone entries, and ergonomic risks as they occur — capturing events workers might miss.
From qualitative to quantified: AI detections generate structured, consistent data — timestamp, location, event type, severity — making aggregation and pattern recognition dramatically easier.
From lagging to leading: Safety teams monitor near-miss frequency in real time. A rising trend in pedestrian-zone near-misses, detected over two weeks, triggers intervention before an injury occurs.
Stop incidents before they start. Predictive safety intelligence correlates detection data across shifts and sites to surface leading indicators and repeatable incident patterns. Start a 30-day safety intelligence pilot to see it in action.
5 Patterns Near-Miss Analysis Reveals
When near-miss data is collected at scale, it reveals five distinct pattern categories.
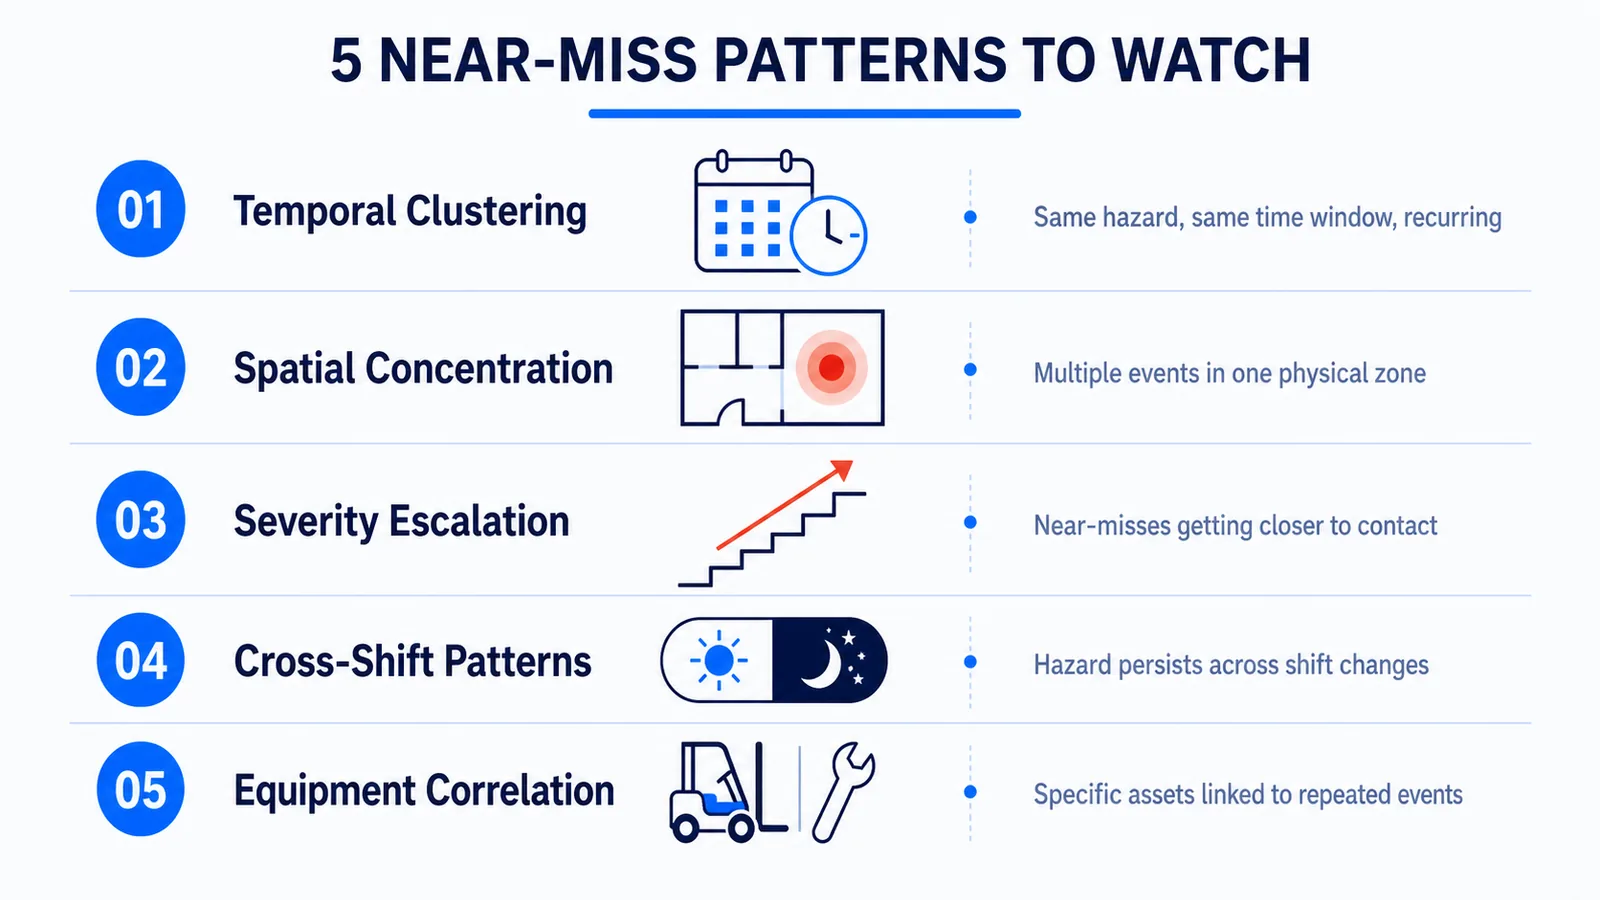
1. Temporal Patterns — Clustering during first hour of shift (fatigue), post-break periods (complacency), or end-of-shift windows (rushing). Answers: When is risk concentrated?
2. Spatial Patterns — Loading docks, pedestrian-vehicle intersections, and poorly lit areas emerge as hotspots. Answers: Where should we focus controls?
3. Behavioral Patterns — Recurring unsafe acts and conditions reveal training gaps: bypassed lockout/tagout, improper lifting, damaged equipment use. Answers: What habits are we allowing?
4. Equipment Patterns — Specific machines with elevated near-miss rates signal maintenance needs or design flaws. Answers: Which assets need attention?
5. Environmental Patterns — Lighting, weather, noise, temperature, and congestion shape frequency. Answers: Under what conditions does risk escalate?
| Pattern Type | Key Question | Typical Intervention |
|---|---|---|
| Temporal | When does risk concentrate? | Adjust scheduling, reinforce protocols during high-risk windows |
| Spatial | Where are the hotspots? | Install barriers, improve lighting, redesign traffic flow |
| Behavioral | What unsafe acts repeat? | Targeted micro-training, procedure clarification, supervision adjustment |
| Equipment | Which assets underperform? | Maintenance scheduling, engineering controls, replacement planning |
| Environmental | Under what conditions does risk rise? | Climate controls, workflow pacing, congestion management |
From Detection to Action: The Response Workflow
Collecting near-miss data creates value only when it drives action.
1. Validate and Triage — Triage by severity potential and frequency to prevent alert fatigue and focus resources where impact is highest.
2. Assign Accountability — Every validated trend needs an owner with a clear deadline. Without ownership, trends become statistics; with ownership, they become projects.
3. Design the Intervention — Match the fix to the pattern. Temporal trends need procedural changes; spatial trends need physical modifications; behavioral trends need targeted training. Address root cause, not symptom.
4. Communicate and Train — Workers who understand why a control is implemented are more likely to support it. Use actual site examples, not generic case studies.
5. Monitor and Close the Loop — Did frequency in the target category decline? Did it shift elsewhere? The AURA (Autonomous Unified Recognition & Action) Engine — an adaptive safety intelligence platform — supports this closed-loop process: detection feeds action, action feeds training, training feeds prevention.
Building a Near-Miss Learning System
A single trend analysis project delivers value. A recurring learning system delivers transformation. Organizations that mature their near-miss programs share five characteristics:
- Integrate multiple data sources. Combine manual reports, AI detections, observation programs, and incident investigations into a unified model where each source validates the others.
- Standardize taxonomies. Use consistent categories for event type, severity, location, and root cause. Without standardization, aggregation becomes impossible.
- Review trends on a cadence. Weekly for operational teams, monthly for site leadership, quarterly for executives. Each layer examines different time horizons.
- Connect to prevention planning. If loading-dock near-misses spiked 40% in Q2 (customer-reported trend example), that data should influence Q3 capital requests. The bridge from analysis to planning is where most programs fail.
- Reduce reporting friction. Even with AI detection, worker reporting remains essential. Simplify with mobile-first interfaces, one-tap submissions, and photo capture.
Measuring the Impact of Near-Miss Programs
Without measurement, near-miss programs become faith-based initiatives.
| KPI | What It Measures | Target Direction | How to Calculate |
|---|---|---|---|
| Near-Miss Reporting Rate | Volume of reports relative to workforce size or hours worked | Up initially (culture shift), then stable | Reports per 100,000 hours or per 100 employees |
| Near-Miss to Incident Ratio | Relationship between close calls and actual injuries | Up (more near-misses per injury signals improved detection) | Near-miss count ÷ injury count |
| Trend Response Time | Speed from pattern identification to intervention deployment | Down | Days between trend alert and first mitigation action |
| Repeat Pattern Reduction | Decline in frequency of previously identified patterns | Down | Compare 90-day near-miss count before and after intervention |
| Intervention Effectiveness | Whether mitigation actions reduced target near-misses | Down | Percentage reduction in target category post-intervention |
| Workforce Participation Rate | Percentage of employees who submitted at least one report | Up | Reporting employees ÷ total workforce |
Track these metrics over time. Sustained improvement over quarters indicates systemic progress. Organizations combining near-miss trend analysis with automated detection have reported measurable reductions in preventable risk events (customer-reported outcome).
Frequently Asked Questions
What is the difference between a near-miss and an unsafe act or condition?
A near-miss is an unplanned event that could have resulted in injury but did not. An unsafe act or condition is a behavior or state with potential to cause harm, whether or not a near-miss occurred. Near-misses are events; unsafe acts and conditions are underlying causes. Effective programs analyze both.
How can we improve near-miss reporting when workers don't participate?
Reduce friction with mobile tools and quick submissions. Remove fear through no-blame policies. Demonstrate response by showing how reports lead to action. Supplement with automated detection to capture events workers miss.
How often should near-miss trend analysis be conducted?
Operational teams should review weekly, site management monthly, and executive leadership quarterly. AI-powered systems enable continuous monitoring that surfaces anomalies without waiting for scheduled reviews.
Can near-miss analysis actually predict serious injuries?
Near-miss analysis predicts where and when risk is concentrating, not whether a specific injury will occur. However, organizations with robust near-miss programs consistently show lower injury rates because they intervene on leading indicators before outcomes materialize (third-party statistic).
What is the best way to present near-miss trends to leadership?
Present three things: what pattern was found, what it could cost if unaddressed, and what intervention is proposed with expected impact. Use visual trend lines, not raw tables. Connect trends to operational metrics like downtime, insurance costs, and regulatory exposure.
Conclusion: Turn Close Calls Into Competitive Advantage
Near-miss trend analysis is not an administrative exercise. It is the primary mechanism by which safety-conscious organizations shift from reactive to predictive. Every close call that goes unanalyzed is a missed opportunity to prevent the next incident. Every pattern that goes unaddressed signals that tomorrow's injury is being written today.
Organizations that lead in industrial safety do not collect more data — they extract more intelligence from the data they have. They combine worker observation, automated detection, systematic analysis, and accountable response into a single learning system. They treat near-misses not as lucky escapes, but as early warnings.
SAFVR's AURA Engine supports this transformation. From AI hazard detection that captures unsafe acts and conditions in real time, to predictive safety intelligence that surfaces leading indicators across sites and shifts, the platform closes the loop between detection and prevention.
Ready to turn your near-miss data into prevention intelligence? Start a 30-day safety intelligence pilot and see what continuous detection reveals about your operational risk.
Related Reading
- Leading vs. Lagging Indicators in Safety — Near-misses are the most powerful leading indicator — learn how to build your program around them.
- Predictive Risk Scoring for Workplace Safety — How near-miss trend data feeds into adaptive risk scoring models.
- Repeat Incident Prevention Strategies — When near-miss patterns recur, these strategies break the cycle.