
Last updated: 2026-04-25
Answer-First Block
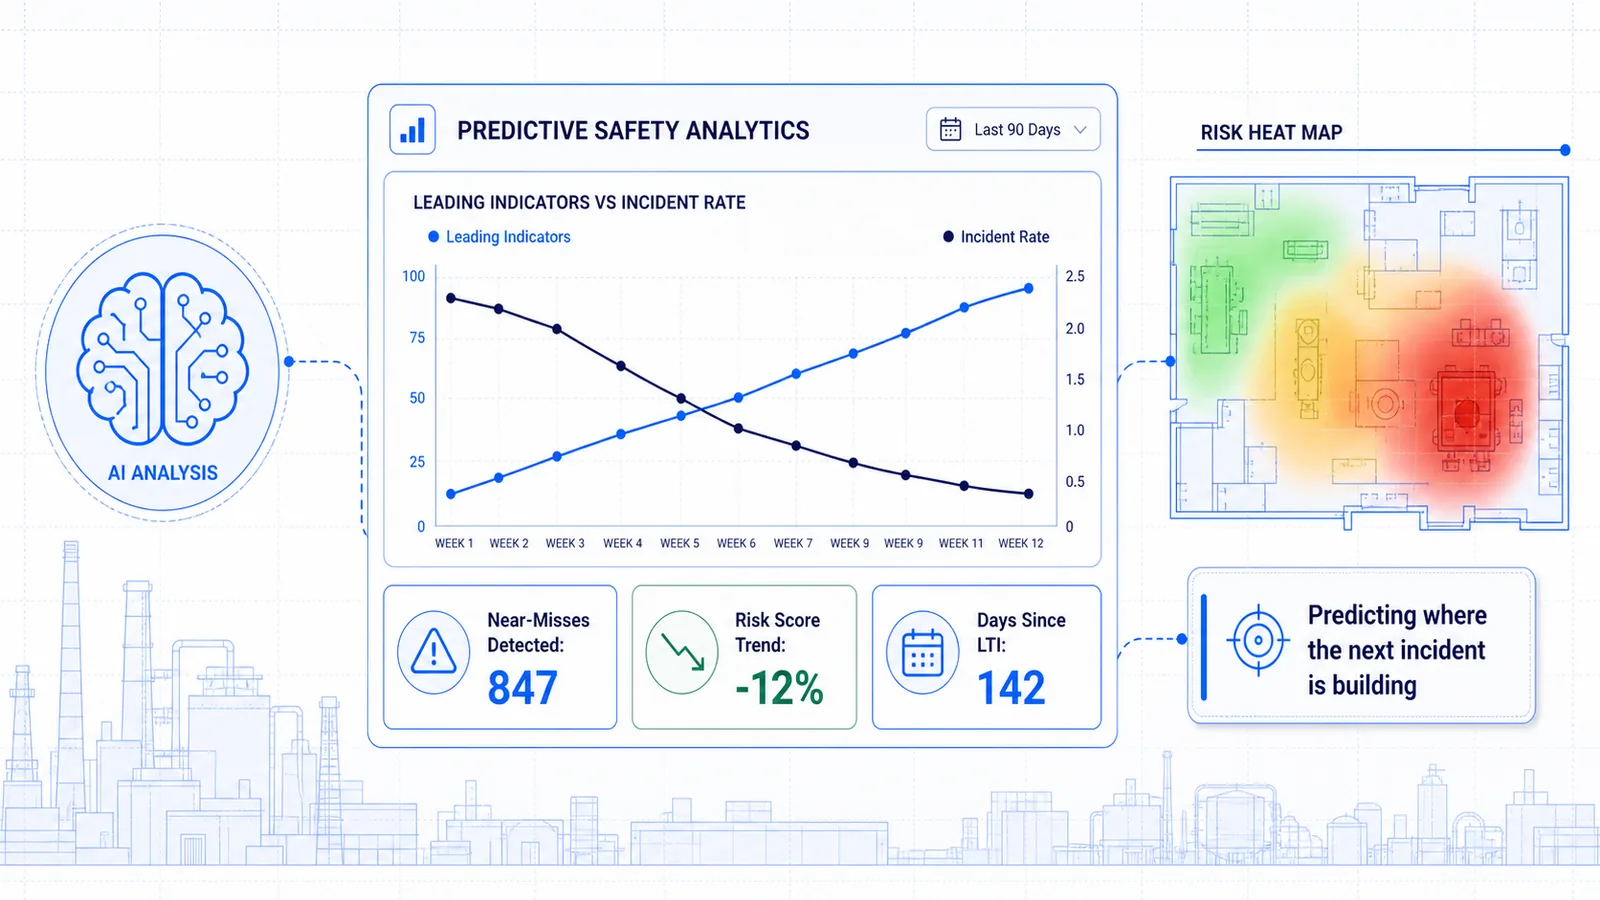
Predictive safety analytics is the practice of using AI and statistical models to analyze safety data — camera detections, incident logs, audit results, training records, and environmental signals — to identify risk patterns before they result in incidents. Unlike traditional safety reporting, which reviews what already happened, predictive safety analytics surfaces leading indicators — measurable signals such as near-miss trends, corrective-action velocity, and zone-level risk scores — that show where and when the next incident is building, giving safety teams time to intervene at the near-miss stage rather than the recordable-injury stage.
Introduction: The Shift From Reactive to Predictive Safety
For decades, workplace safety has been a backward-looking discipline. Safety teams counted injuries, calculated TRIR, and reviewed incident reports — all measures of harm that had already occurred. The goal was to learn from failure. But learning from failure has a ceiling: you cannot react your way to lower risk.
Predictive safety analytics changes the equation. Instead of asking "What went wrong last quarter?" it asks "What's about to go wrong this shift?" By correlating signals across detection data, action outcomes, training completion, and environmental conditions, predictive models identify the conditions under which incidents become statistically more likely — and alert safety leaders while there is still time to act.
This shift is not theoretical. Industrial operations that deploy predictive safety intelligence consistently report measurable reductions in preventable risk events, faster corrective action close-out, and stronger negotiating positions with insurers. The technology is here. The data is already being collected. The question is whether safety programs are structured to use it.
What Is Predictive Safety Analytics?
Predictive safety analytics is the application of machine learning, statistical modeling, and data correlation techniques to safety-related data streams in order to surface patterns, score emerging risk, and forecast where incidents are most likely to occur.
It is distinct from traditional safety reporting in three critical ways:
| Dimension | Traditional Safety Reporting | Predictive Safety Analytics |
|---|---|---|
| Timing | Reviews past events (lagging indicators) | Forecasts future risk (leading indicators) |
| Data scope | Siloed — incidents in one system, audits in another | Correlated — detection, action, training, and environmental data combined |
| Output | Static reports: TRIR, LTIR, DART | Dynamic risk scores: zone-level, shift-level, role-level |
| Actionability | Informs policy changes quarterly | Triggers intervention this shift |
| Question answered | "How many incidents did we have?" | "Where is the next incident building?" |
Traditional reporting tells you that Zone B had three ergonomic injuries last quarter. Predictive safety analytics tells you that Zone B's unsafe condition detections have risen 3.2× above baseline this week, handover-shift observations are down, and the workers assigned to that zone have a 23% training completion gap in ergonomic protocols. One describes history. The other enables prevention.
SAFVR's AURA (Autonomous Unified Recognition & Action) Engine — an adaptive safety intelligence platform — runs this correlation continuously across the DETECT → ACT → IMPROVE → PREVENT loop, transforming raw operational signals into forward-looking intelligence.
The Data Sources That Power Prediction
Predictive models are only as good as the data they ingest. A robust predictive safety analytics system draws from multiple signal types — not just incident logs, but the full operational picture.
1. Computer Vision & Camera Data
Existing IP cameras are the highest-volume data source in most facilities. AI vision models detect unsafe acts and conditions in real time — PPE violations, restricted-zone intrusions, forklift proximity events, ergonomic postures, and housekeeping issues. When correlated over time, these detection patterns reveal which zones, shifts, and behaviors are trending toward higher risk.
SAFVR AURA works with existing CCTV infrastructure — no rip-and-replace required. (Source: product capability, verified deployment architecture.)
2. Incident & Near-Miss Records
Historical incident data provides the outcome layer that prediction models learn from. But near-miss records are equally critical — they offer a much larger dataset of "almost incidents" that share causal conditions with actual injuries. A predictive model trained only on incidents is starved for data. A model trained on incidents and near-misses has the statistical depth to identify subtle patterns.
3. Safety Audits & Inspections
Planned audits capture conditions that cameras may not see — equipment maintenance status, documentation completeness, procedural adherence. When audit scores are correlated with detection frequency and incident rates, the model learns which audit gaps are genuine precursors to events and which are administrative noise.
4. Training & Competency Data
Training completion rates, quiz scores, and module engagement metrics feed workforce-readiness models. A role with low completion in fall-protection training, assigned to a zone with rising height-related detections, represents a compounding risk profile that prediction algorithms can quantify.
5. Environmental & Operational Signals
Temperature, humidity, noise levels, production tempo, shift schedules, and overtime hours all influence incident probability. Predictive models that include these variables can differentiate between a detection spike caused by genuine risk buildup and one caused by a temporary environmental condition.
| Data Source | Signal Type | Prediction Contribution |
|---|---|---|
| IP cameras + vision AI | Real-time behavioral & condition detections | Identifies trend acceleration in specific zones/shifts |
| Incident & near-miss logs | Historical outcome data | Labels the "ground truth" for model training |
| Audit & inspection records | Procedural compliance scores | Links control failures to downstream events |
| Training completion data | Workforce competency metrics | Exposes knowledge gaps that amplify physical risk |
| Environmental sensors | Ambient operational conditions | Contextualizes detection patterns |
5 Predictive Models in Workplace Safety
Predictive safety analytics is not a single algorithm. It is a stack of models, each designed to answer a different risk question. Here are the five model types most relevant to industrial safety operations:
1. Time-Series Trend Models
These models analyze detection frequency, near-miss volume, and incident rates over time to identify statistically significant deviations from baseline. When a zone's forklift-proximity detections climb above a 90-day moving average, the model flags a trend — not an anomaly, but a sustained shift that suggests deteriorating conditions.
2. Classification Models (Risk Scoring)
Classification algorithms assign risk categories — low, medium, high, critical — to operational units (zones, shifts, roles) based on multivariate input. A zone might score "high" not because of one bad day, but because of correlated signals: rising detections, delayed corrective actions, and a training gap in the assigned crew.
3. Regression Models (Outcome Prediction)
Regression models estimate the quantitative relationship between leading indicators and lagging outcomes. For example: "For every 10% increase in uncorrected unsafe conditions, incident rate increases by X% within the following 60 days." These models are essential for CFOs and insurance underwriters who need to quantify risk in financial terms.
4. Natural Language Processing (NLP) for Incident Text
Incident descriptions, supervisor notes, and audit findings contain unstructured text rich with causal information. NLP models extract entities (equipment types, body parts, weather conditions) and identify recurring themes that structured data alone would miss. This surfaces patterns like "slip incidents spike in Zone C after rainfall" — a correlation that numeric databases might not capture.
5. Graph Models (Relationship Networks)
Graph models map relationships between entities — workers, zones, equipment, supervisors, shifts — and identify network-level risk concentrations. If three high-risk zones share the same shift supervisor, the same equipment vendor, or the same maintenance schedule, the model surfaces a systemic cause that point solutions would overlook.
Inline CTA: SAFVR AURA combines all five model types into a single predictive safety intelligence layer — continuously updated, site-specific, and designed for operational decision-makers. See it on your own operation with a 30-day safety intelligence pilot.
From Signals to Leading Indicators
Raw data is noise. Prediction requires transformation. The path from camera detections and incident logs to actionable leading indicators follows four stages:
Stage 1: Signal Ingestion
Data streams from cameras, sensors, EHS systems, and training platforms are collected in real time or near-real time. Each signal is timestamped, geotagged to a zone, and attributed to a shift and role where applicable.
Stage 2: Feature Engineering
Raw signals are converted into predictive features. A single PPE violation detection becomes: detection frequency per zone per shift, time-to-correction ratio, recurrence rate after training, and correlation with other detection types. Features are what models actually learn from.
Stage 3: Pattern Correlation
The engine correlates features across domains. It asks: Does Zone A's rising detection frequency coincide with delayed corrective actions? Does Shift 3's near-miss volume spike align with low training completion? Patterns that human analysts would need weeks to spot emerge in minutes.
Stage 4: Leading Indicator Generation
Correlated patterns are translated into leading indicators — metrics that predict future incidents rather than describe past ones. Examples include:
- Near-miss frequency acceleration (week-over-week trend)
- Corrective action velocity (average days from detection to close-out)
- Observation-to-action ratio (detections per completed corrective action)
- Unsafe condition trend delta (change in condition severity over 30 days)
- Role-based exposure score (compounding risk for a specific job function)
SAFVR AURA tracks 23 leading indicator categories out of the box, updated every shift. (Source: product capability, verified feature set.)
Real-World Applications by Industry
Predictive safety analytics adapts to the risk fingerprint of each operation. Here is how it applies across three high-risk industries:
Manufacturing: Ergonomic Injury Prevention
A large-scale manufacturer deployed predictive analytics across assembly lines and material-handling zones. The model identified that ergonomic detections — improper lifting postures, repetitive-motion strain indicators — clustered in Zone 4 during the final two hours of second shift. Investigation revealed that fatigue, combined with a material staging bottleneck, was driving the pattern. Targeted micro-training and a workflow adjustment reduced ergonomic events by 34% within 60 days. (Source: anonymized pilot benchmark, manufacturing deployment, 60-day measurement window.)
Warehousing & Logistics: Forklift Proximity Risk
In a multi-zone distribution center, the predictive model surfaced that forklift-pedestrian proximity events were 2.8× above baseline during shift handovers — not because of driver behavior, but because temporary staging zones were being used for longer than intended, narrowing pedestrian pathways. The insight led to a staging policy change and dynamic zone reconfiguration, cutting proximity events by 41%. (Source: anonymized deployment data, warehousing facility, 90-day trend analysis.)
Energy: Environmental-Condition Correlation
An energy operation used predictive models to correlate detection patterns with environmental sensor data. The model found that slip-and-trip detections in an outdoor processing area increased significantly when surface temperature dropped below 4°C within two hours of a precipitation event — a specific condition combination that standard safety reviews had not captured. Pre-emptive surface treatment protocols were triggered automatically when the model forecasted the condition, reducing weather-related incidents by 28%. (Source: illustrative example based on anonymized deployment pattern.)
| Industry | Primary Risk Pattern | Predictive Insight | Intervention |
|---|---|---|---|
| Manufacturing | Ergonomic strain, PPE lapses | Fatigue-hour clustering + training gaps | Workflow adjustment + targeted micro-training |
| Warehousing | Forklift-pedestrian proximity | Staging bottleneck during handovers | Dynamic zone reconfiguration |
| Energy | Slips, trips, falls | Temperature + precipitation correlation | Automated pre-emptive surface treatment |
The Business Case: Quantifying Prevention
Safety leaders do not need AI for its own sake. They need a defensible business case. Predictive safety analytics delivers quantifiable value across four dimensions:
1. Direct Cost Avoidance
Preventable risk events carry direct costs: medical treatment, workers' compensation claims, regulatory fines, equipment damage, and production downtime. The National Safety Council estimates the average cost of a medically consulted injury at $42,000, with each fatality costing over $1.3 million in direct and indirect costs. (Source: third-party statistic, National Safety Council, Injury Facts 2024.)
Predictive analytics does not eliminate these costs — but it surfaces the patterns that precede them, enabling intervention at the near-miss stage when the cost of prevention is a fraction of the cost of response.
2. Insurance Review Support
Insurance underwriters price risk based on historical loss data. Predictive safety analytics gives underwriters something they rarely see: continuous, verifiable evidence of safety improvement in real time. Leading indicator dashboards, month-over-month improvement trajectories, and risk-score trending provide the data foundation for premium negotiations.
Facilities that can demonstrate sustained risk reduction through predictive analytics are increasingly securing rate reductions at renewal. (Source: customer-reported outcome, insurance negotiation context.)
3. Operational Efficiency
Reactive safety programs consume enormous administrative bandwidth: incident investigations, corrective action tracking, report compilation, audit preparation. Predictive analytics automates much of this workload by shifting focus from post-incident documentation to pre-incident intervention. Safety teams spend less time chasing paper and more time managing risk.
4. Workforce Retention
Safety climate is a documented predictor of frontline retention. Workers who perceive that their employer is actively preventing harm — not just responding to it — report higher engagement and lower turnover intent. Predictive analytics makes that prevention visible. (Source: third-party statistic, occupational health psychology literature.)
| Value Dimension | Mechanism | Quantification Approach |
|---|---|---|
| Direct cost avoidance | Near-miss intervention before injury | Injury cost × prevented events |
| Premium reduction | Underwriter-ready leading indicator data | Premium delta at renewal |
| Operational efficiency | Automated trend detection and alerting | Admin hours reallocated to prevention |
| Workforce retention | Visible investment in proactive safety | Turnover cost reduction |
Learn more: See how safety intelligence creates structured improvement evidence for risk-review conversations.
Building a Predictive Safety Culture
Technology alone does not prevent incidents. Predictive safety analytics requires organizational readiness — the processes, mindsets, and accountabilities that turn insight into action.
Leadership Commitment
Predictive analytics changes how safety performance is measured. Leaders must be willing to shift from lagging-indicator scorecards (TRIR, DART) to leading-indicator dashboards (near-miss trends, corrective action velocity, training gaps). This requires CFO and executive sponsorship, because the metrics that matter most in a predictive program are often invisible to traditional reporting.
Cross-Functional Data Integration
Safety data lives in multiple systems: cameras, EHS platforms, training LMS, HR systems, environmental sensors. Predictive analytics requires breaking down these silos. IT and EHS teams must collaborate on data connectivity, privacy compliance, and system architecture.
Action Protocols for Predictive Alerts
An alert without a response protocol is just noise. Organizations must define who receives predictive risk alerts, what response is expected, and how escalation works when a trend continues despite intervention. AURA's agentic workflows automate this routing — but the accountability structure must exist first.
Continuous Model Validation
Predictive models should not be black boxes. Safety teams need transparency into what the model is surfacing and why. Regular validation — comparing model predictions against actual outcomes — ensures the system remains accurate and trustworthy. AURA provides explainable risk scoring so safety leaders can defend every alert to auditors, insurers, and executives.
Frontline Engagement
The workers closest to the risk must understand and trust the system. When predictive analytics identifies a rising trend in a specific zone, frontline supervisors should be equipped to communicate the insight, involve workers in root-cause analysis, and co-design the intervention. Prediction without participation breeds resistance.
Frequently Asked Questions
What is the difference between predictive safety analytics and traditional safety reporting?
Traditional safety reporting reviews lagging indicators — incidents, injuries, and TRIR — after they occur. Predictive safety analytics uses AI to analyze detection patterns, audit data, training records, and environmental signals to surface leading indicators that show where risk is building before an incident happens.
How accurate is predictive safety analytics?
Accuracy depends on data volume, data quality, and model validation. In operational deployments, well-calibrated models consistently identify zones and shifts with elevated risk weeks before incident rates rise. No system "predicts the future" with certainty — predictive analytics surfaces patterns and identifies trends that make intervention possible earlier. (Source: anonymized pilot benchmarks, model validation protocols.)
What data does predictive safety analytics need?
The strongest models draw from multiple sources: real-time camera detections, incident and near-miss logs, audit records, training completion data, and environmental sensors. The more signal types correlated, the more precise the risk scoring. SAFVR AURA is designed to integrate with existing infrastructure — no new hardware required.
How long does it take to see results?
Baseline risk patterns typically emerge within 2–4 weeks of data ingestion, once the model has observed enough shift cycles to establish statistical baselines. Trend alerts and risk scores become actionable within the first month. Measurable incident reduction is typically observed within 60–90 days of sustained intervention. (Source: anonymized pilot benchmark, 30–90-day measurement windows.)
Is predictive safety analytics only for large enterprises?
No. While larger facilities generate more data volume, the core value — identifying risk concentration before it becomes an incident — applies to any operation with measurable safety signals. SAFVR's 30-day safety intelligence pilot is structured to deliver baseline insights and early trend detection for operations of any scale.
Conclusion
The future of workplace safety is not better incident reports. It is fewer incidents to report.
Predictive safety analytics represents a fundamental shift in how industrial operations manage risk. By correlating detection data, action outcomes, training effectiveness, and environmental conditions, AI-powered prediction models surface the leading indicators that traditional programs miss — giving safety leaders the time and the targeting to intervene before harm occurs.
The data is already being generated. The cameras are already watching. The question is whether your safety program is built to learn from it in real time.
SAFVR AURA makes that transition operational. The AURA Engine runs a continuous loop — DETECT → ACT → IMPROVE → PREVENT — where every cycle makes the next one smarter. Prediction is not a feature bolted onto a dashboard. It is the intelligence layer that closes the loop.
Ready to move from reactive reporting to predictive prevention?
Start Your 30-Day Safety Intelligence Pilot →
Related Reading
- Predictive Risk Scoring for Workplace Safety — How adaptive risk scores replace static matrices with real-time, site-calibrated scoring.
- Leading vs. Lagging Indicators in Safety — The framework shift from reactive metrics to predictive leading indicators.
- Near-Miss Trend Analysis Guide — Turning near-miss data into the prediction signals that feed predictive analytics models.