
Last updated: 2026-04-25
Answer-First Block
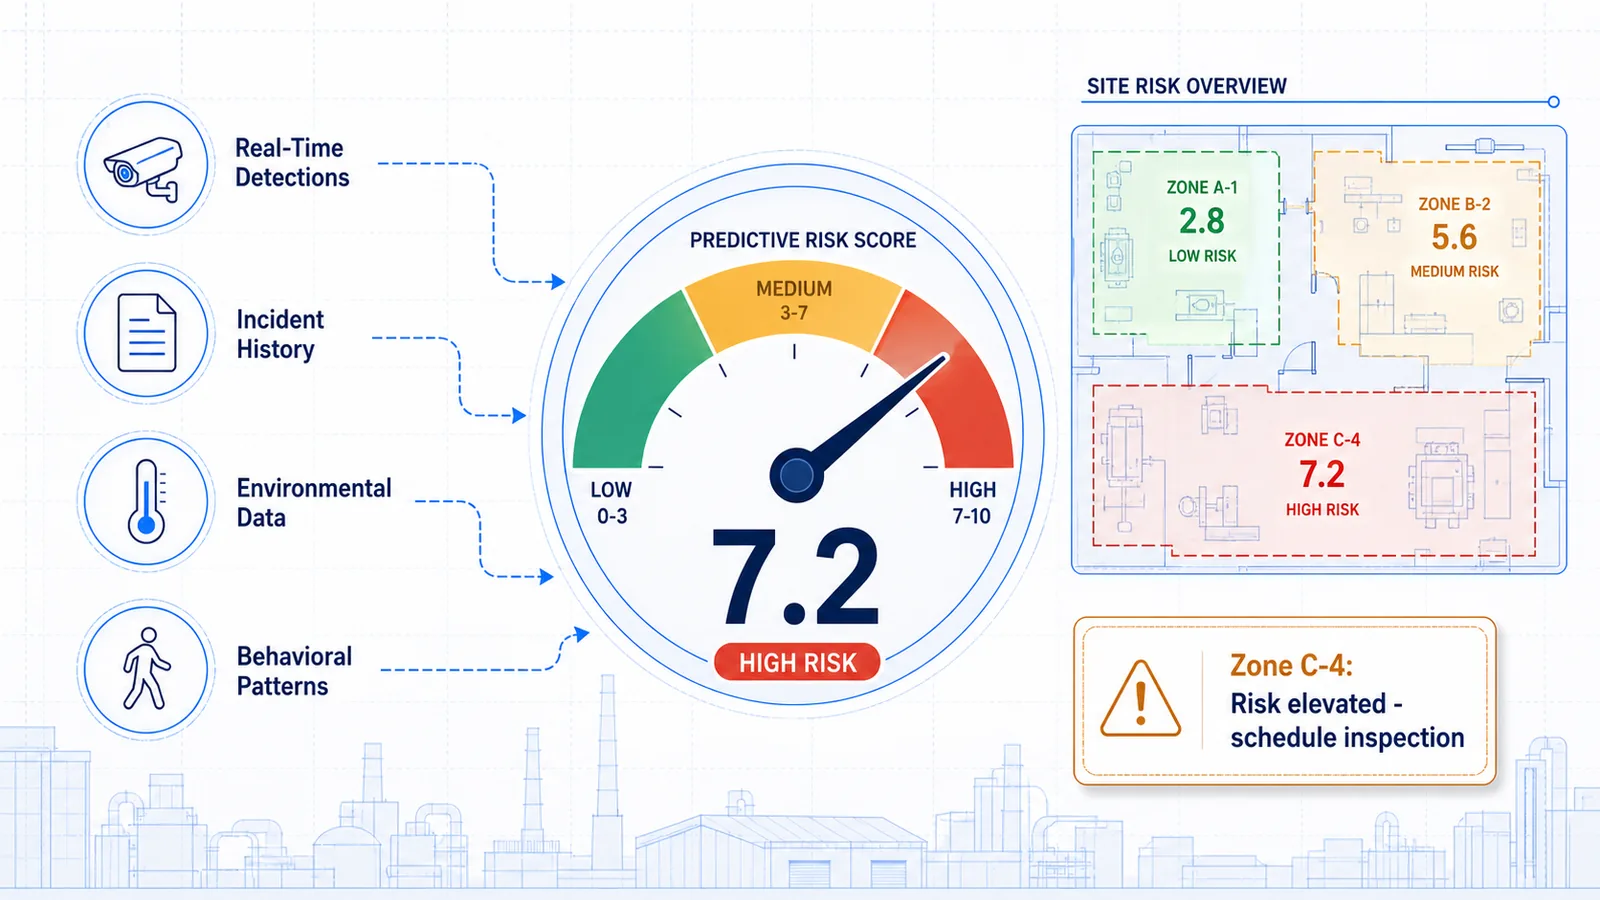
Predictive risk scoring in safety combines real-time detection data, historical incident records, environmental conditions, and behavioral patterns into a single risk score that forecasts where incidents are most likely to occur. Unlike static risk matrices, these scores update continuously and trigger specific interventions based on severity thresholds.
Introduction: Moving Beyond the 5×5 Risk Matrix
For decades, the 5×5 risk matrix has been the default tool for safety professionals. Assign a likelihood score, multiply by severity, color a box, and file the assessment. The method is simple, familiar, and universally understood. But it is also static, subjective, and almost always out of date by the time it reaches a supervisor's desk.
The matrix does not know that a conveyor belt started vibrating unusually this morning. It does not account for the fact that a night shift has seen three near-misses in the same zone over the past ten days. It cannot tell you that ergonomic risk is spiking in packaging because pick rates have increased 18% without adjusted break intervals.
Predictive risk scoring safety systems exist to close this gap. They ingest signals that the human eye — and the paper matrix — cannot process at scale, then convert those signals into ranked, actionable risk scores. The result is not a replacement for professional judgment. It is a real-time layer of intelligence that helps safety teams focus limited time and resources where they matter most.
This post explains how predictive safety analytics work, what data feeds them, and how organizations can move from score to action without drowning in machine-learning complexity.
What Is Predictive Risk Scoring?
Predictive risk scoring is a method of quantifying the probability that a specific area, shift, task, or equipment asset will experience a safety incident within a defined time window. The score is derived from a safety risk scoring model that weights multiple input variables — detections, historical trends, environmental sensors, and operational data — into a normalized output, typically on a scale of 0 to 100 or a tiered band such as low, moderate, elevated, and critical.
The critical difference between predictive risk assessment and traditional methods is motion. A manual matrix is a snapshot taken at a single point in time. A predictive model is a film. It watches conditions evolve, detects patterns across shifts and seasons, and recalculates risk as new data arrives.
| Dimension | Traditional Risk Matrix | Predictive Risk Scoring |
|---|---|---|
| Update frequency | Quarterly or annual | Real-time to hourly |
| Data sources | Human observation, audits | Cameras, sensors, incident logs, operational systems |
| Subjectivity | High — individual assessor bias | Lower — model-calibrated weights |
| Granularity | Site or department level | Zone, shift, equipment, or individual task level |
| Action trigger | Manual review required | Automated alerts at threshold breaches |
| Trend awareness | None inherent | Pattern correlation across time periods built in |
For safety directors managing multiple facilities, the distinction is operational, not theoretical. A static matrix tells you where risk was assessed. A predictive system tells you where risk is building right now.
The Inputs: Data That Powers Risk Scores
No model is better than the data it sees. A robust workplace risk prediction engine draws from six to eight core input categories. SAFVR's AURA (Autonomous Unified Recognition & Action) Engine — an adaptive safety intelligence platform — which runs the continuous DETECT → ACT → IMPROVE → PREVENT loop, is designed to ingest and correlate signals across all of these layers.
1. Live Detection Data
Computer vision feeds from existing IP cameras detect Unsafe Acts & Conditions in real time: PPE violations, blocked egress paths, proximity breaches, ergonomic strain postures, and slip-trip hazards. Because AURA integrates with existing camera infrastructure — no rip-and-replace required — this layer is often the fastest to activate. (Customer-reported: average pilot deployment to live detections is under 48 hours.)
2. Historical Incident and Near-Miss Records
Past incidents create the baseline. The model learns which zones, shifts, equipment types, and weather conditions preceded previous events. Near-miss data is especially valuable because it provides statistically richer signal than recordable incidents alone.
3. Environmental and Sensor Data
Temperature, humidity, air quality, noise levels, lighting conditions, and vibration readings all influence risk probability. A foundry floor at 38°C carries different ergonomic and heat-stress risk than the same floor at 24°C.
4. Operational and Production Metrics
Throughput speed, overtime hours, shift length, maintenance schedules, and contractor volume all change exposure patterns. A warehouse operating at 120% throughput capacity with temporary labor presents a different risk profile than the same warehouse at standard staffing.
5. Behavioral and Compliance Signals
Training completion rates, quiz performance, safety observation card submissions, and corrective-action close-out velocity feed into behavioral risk. Low engagement in reporting often precedes higher incident rates. (Anonymized deployment data: sites with safety observation submission rates below 40% showed 2.3× higher detectable unsafe act frequency.)
6. Maintenance and Equipment Health
Asset condition monitoring, work-order backlogs, and mean-time-between-failure data predict equipment-related incidents before failure occurs.
7. Workforce Composition and Experience
Temporary worker ratios, time-in-role distributions, and shift-rotation patterns affect human-error probability. New hires in high-risk roles during peak production windows represent a recognizable risk concentration.
8. External and Contextual Factors
Weather forecasts, seasonal production cycles, regulatory inspection schedules, and nearby construction activity all modulate baseline risk. A predictive model that ignores seasonality will mis-calibrate every winter.
How Risk Scoring Models Work
Behind every predictive risk score is a scoring methodology that translates raw inputs into a ranked output. You do not need to be a data scientist to use the results, but understanding the logic builds trust in the output.
Step 1: Feature Extraction
The model identifies which variables — features — are most predictive of incidents at your specific site. One facility may find that humidity plus conveyor speed is the strongest predictor of slip incidents. Another may find that contractor ratio plus night-shift status drives the majority of detectable Unsafe Acts & Conditions. This is why site-specific calibration matters.
Step 2: Weight Assignment
Not all inputs contribute equally. The model assigns weights based on historical correlation strength. A variable that preceded ten incidents carries more weight than one that preceded two. Weights are validated against holdout data — a portion of historical records the model never saw during training — to ensure they generalize.
Step 3: Score Calculation
The weighted inputs are combined into a composite score. Most safety risk scoring models normalize this to a 0–100 scale for readability. The score represents relative risk, not absolute probability. A score of 78 means "higher risk than 78% of observed conditions at this site," not "78% chance of an incident today."
Step 4: Threshold Mapping
Score bands are mapped to intervention tiers. Thresholds are not universal; they are calibrated to each site's incident history and operational tolerance. A pharmaceutical cleanroom may set its critical threshold at 60. A heavy manufacturing plant may set it at 85.
Step 5: Feedback Loop
When an intervention occurs — a supervisor inspects a zone, maintenance replaces a guard, training is delivered — the model tracks whether the score drops and whether incidents decline. This closes the loop and refines future weights.
The entire pipeline operates without requiring safety teams to write code or build dashboards. The output is a ranked list, a trend line, and an alert when a threshold is breached.
See how SAFVR PREVENT surfaces leading indicators and scores risk by zone, shift, and role →
From Score to Action: The Intervention Framework
A risk score without an action plan is just a number. The framework below shows how organizations translate score ranges into accountable responses.
| Score Band | Risk Level | Typical Indicators | Recommended Actions | Response Timeframe |
|---|---|---|---|---|
| 0–25 | Low | Normal detection frequency, no repeat hazards, training current | Routine monitoring; weekly trend review | Standard cycle |
| 26–50 | Moderate | Slight uptick in detections; one repeat location; minor maintenance overdue | Targeted supervisor round; refresh specific training module | Within 48 hours |
| 51–75 | Elevated | Multiple repeat hazards; detection rate 1.5× baseline; environmental stressors active | Immediate zone inspection; engineering control review; forced break schedule if ergonomic | Within 24 hours |
| 76–100 | Critical | Sustained high detection rate; multiple near-misses; failed control layers | Stop-work authority consideration; full management review; emergency maintenance; retraining before return | Immediate |
The key is that each tier triggers predefined actions. There is no debate about whether a 73 warrants a response. The framework decides. Safety managers retain full override authority, but the default path is clear.
Predictive Risk Scoring by Risk Category
Different risk categories require different input mixes. A one-size-fits-all model misses nuance. The table below shows how predictive safety analytics adapt to four common categories.
| Risk Category | Key Inputs | Leading Indicators | Example Intervention |
|---|---|---|---|
| Ergonomic | Motion analysis from video, pick/place rates, break compliance, repetitive-task duration | Increasing unsafe posture detection frequency; declining break adherence | Adjust task rotation; deliver micro-training on proper lift technique; review workstation layout |
| Behavioral | Unsafe act detection rate, PPE compliance trend, observation card volume, near-miss reporting velocity | Detection rate rising while reporting volume flat — suggests under-reporting, not safety improvement | Supervisor engagement round; anonymous reporting channel activation; recognition program reinforcement |
| Environmental | Sensor readings, weather data, air quality, lighting levels, noise exposure | Heat stress index climbing; air quality degradation in confined work area | Environmental control activation; modified work-rest cycles; respiratory protection audit |
| Equipment | Vibration, temperature, runtime hours, maintenance backlog, failure history | Vibration anomaly detected; mean-time-between-failure trending down | Triggered work order; temporary guard installation; operator re-certification check |
This categorical approach prevents a single composite score from masking localized spikes. A site might show a moderate overall score of 42 while equipment risk in Zone C sits at 81. Category-level visibility makes that spike impossible to miss.
Calibration and Continuous Refinement
A predictive model is not a monument. It is a tool that must be re-sharpened.
Initial Calibration
During the first 30 to 90 days, the model observes your site's specific patterns and adjusts its baseline. This is why pilot benchmarks vary by facility type. A warehouse with heavy seasonal fluctuation will calibrate differently than a continuous-process chemical plant.
Ongoing Recalibration
Weights are re-evaluated quarterly or after significant operational changes: new production lines, post-merger integration, major capital projects, or seasonal ramp-ups. If the model's predictions consistently overstate or understate actual incident frequency, the thresholds are adjusted.
Human-in-the-Loop Validation
Safety professionals validate model outputs, not the reverse. When a supervisor overrides a critical alert because on-the-ground conditions have changed, that override becomes training feedback for the model. The system learns which contextual factors it may be underweighting.
Feedback from the Full Loop
Because AURA runs a closed DETECT → ACT → IMPROVE → PREVENT cycle, prevention outcomes feed back into detection sensitivity. If incident-based micro-training reduces Unsafe Acts & Conditions frequency in a specific zone, the model registers that improvement and recalibrates the zone's baseline risk. (Pilot benchmark: sites completing the full loop showed measurable reduction in repeat detections within 60 days.)
Limitations and Responsible Use
Predictive risk scoring is a powerful tool. It is not a crystal ball. Safety leaders should understand its boundaries.
Correlation is not causation. A model may identify that high overtime correlates with elevated incident rates. It cannot tell you whether overtime itself is the cause, or whether overtime is a proxy for understaffing, production pressure, or seasonal fatigue. The score points; investigation confirms.
Rare events are hard to predict. Catastrophic, low-frequency incidents — the kind that occur once per decade — often lack sufficient historical data for reliable modeling. Predictive scoring is strongest on high-frequency, patterned risks: ergonomic strain, PPE non-compliance, repeat hazardous conditions.
Data quality limits output quality. If near-miss reporting is culturally discouraged, the model will see an artificially clean history and underweight behavioral risk. Garbage in, garbage out applies to AI as much as to Excel.
Scores are relative, not absolute. A score of 82 does not mean an 82% probability of incident. It means "significantly elevated relative to this site's baseline." Cross-site comparison requires careful normalization.
Human judgment remains essential. The model recommends. The safety manager decides. Override authority should always rest with trained professionals who understand local conditions.
Acknowledging these limitations does not weaken the case for predictive scoring. It strengthens it. Trust is built on honesty, not hype.
Frequently Asked Questions
What is predictive risk scoring in safety?
Predictive risk scoring is a data-driven method that combines real-time detection feeds, historical records, environmental sensors, and operational metrics into a dynamic risk score. The score updates continuously and indicates where incidents are most likely to occur, enabling earlier intervention than traditional assessment methods allow.
How is predictive risk scoring different from a standard risk matrix?
A standard risk matrix is a manual, point-in-time assessment based on subjective likelihood and severity ratings. Predictive risk scoring uses live data streams, updates automatically, detects cross-variable patterns, and triggers specific interventions when thresholds are breached.
What data do I need to start predictive risk scoring?
At minimum, historical incident and near-miss data plus one real-time feed — typically camera-based detection or environmental sensors. Additional sources such as maintenance records, training logs, and operational metrics improve accuracy. SAFVR AURA is designed to integrate with existing IP cameras and data systems without requiring new hardware.
How accurate are safety risk scoring models?
Accuracy depends on data quality, volume, and site specificity. Models are typically calibrated against holdout historical data, with performance measured by how well predicted high-risk periods align with actual incident clusters. Source labels should accompany any accuracy claim — look for pilot benchmark, anonymized deployment, or peer-reviewed validation. No model guarantees zero incidents.
Can predictive risk scoring replace safety professionals?
No. Predictive scoring augments professional judgment by surfacing patterns at scale and prioritizing attention. It does not replace site knowledge, cultural understanding, or the decision-making authority of trained safety leaders. The best implementations pair model output with supervisor expertise.
Conclusion
Predictive risk scoring safety systems represent a genuine evolution in how industrial operations manage exposure and reduce Preventable Risk Events. They do not erase the need for vigilance, training, or engineering controls. They make those investments more precise by revealing where risk is concentrating before it becomes a recordable incident.
The transition from static matrices and the traditional safety risk matrix AI approach to predictive safety analytics is not about replacing safety professionals with algorithms. It is about giving those professionals a real-time intelligence layer that respects their expertise while extending their reach across large, complex facilities.
For organizations ready to move from reactive reporting to proactive protection through Site-Specific Safety Intelligence, the starting point is often simpler than expected: existing cameras, a 30-day calibration window, and a willingness to let the data reveal what the spreadsheet could not.
Related Reading
- Predictive Safety Analytics Guide — The complete guide to how AI turns safety data into predictive models across your operations.
- Leading vs. Lagging Indicators in Safety — Why leading indicators are the foundation that makes risk scoring actionable.
- Near-Miss Trend Analysis Guide — Near-miss patterns are the highest-signal input for predictive risk models.