
Last updated: 2026-04-25
Answer-First Summary
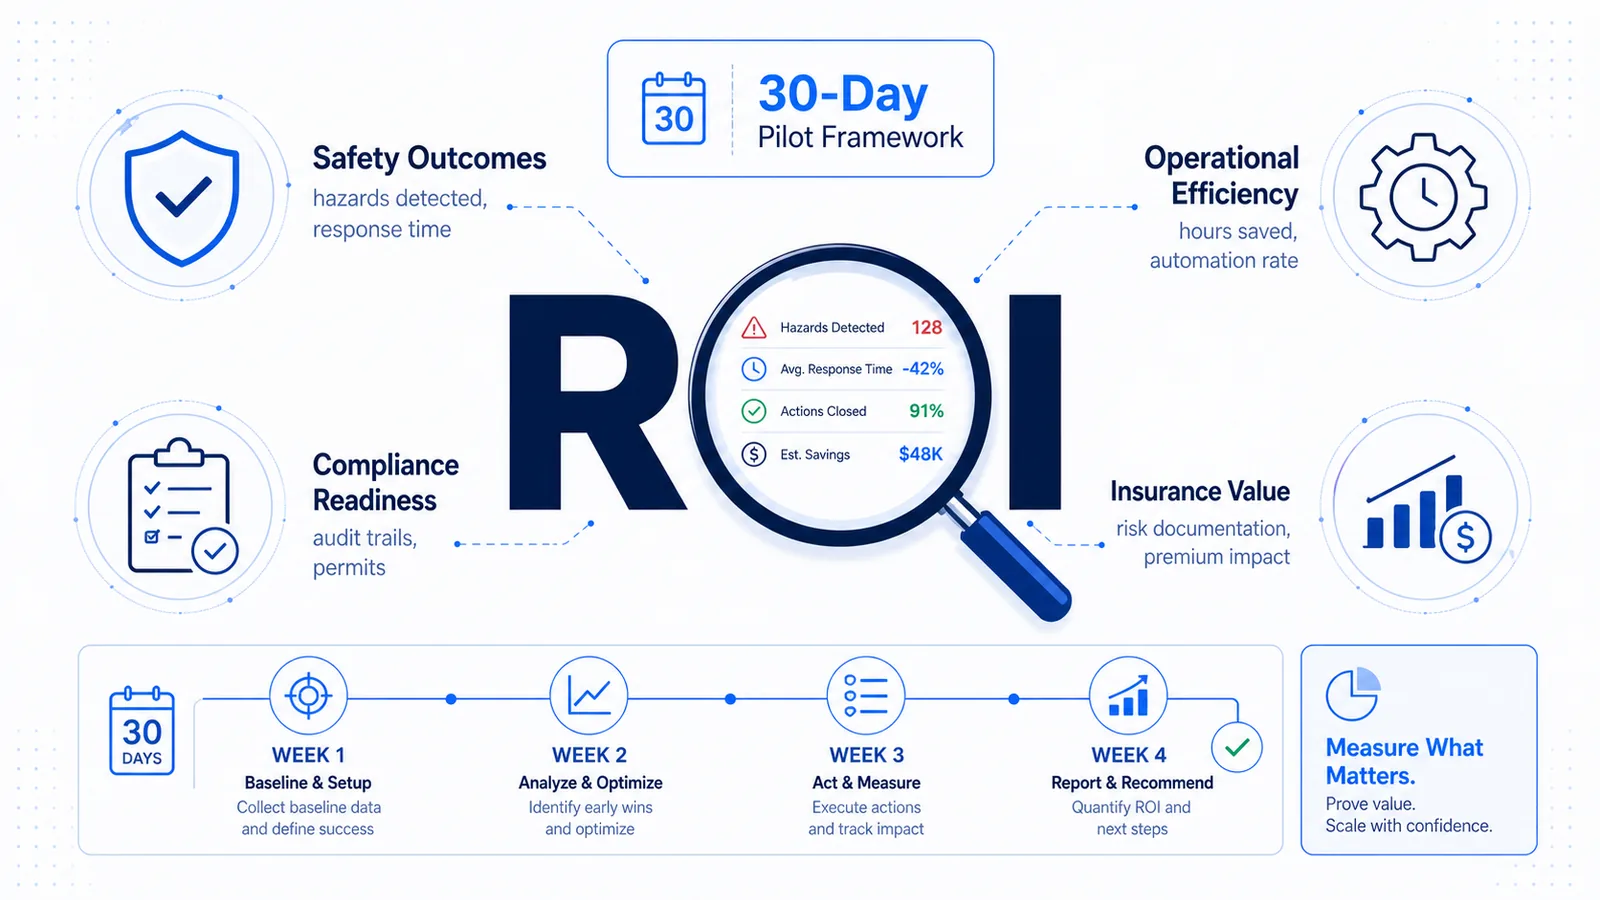
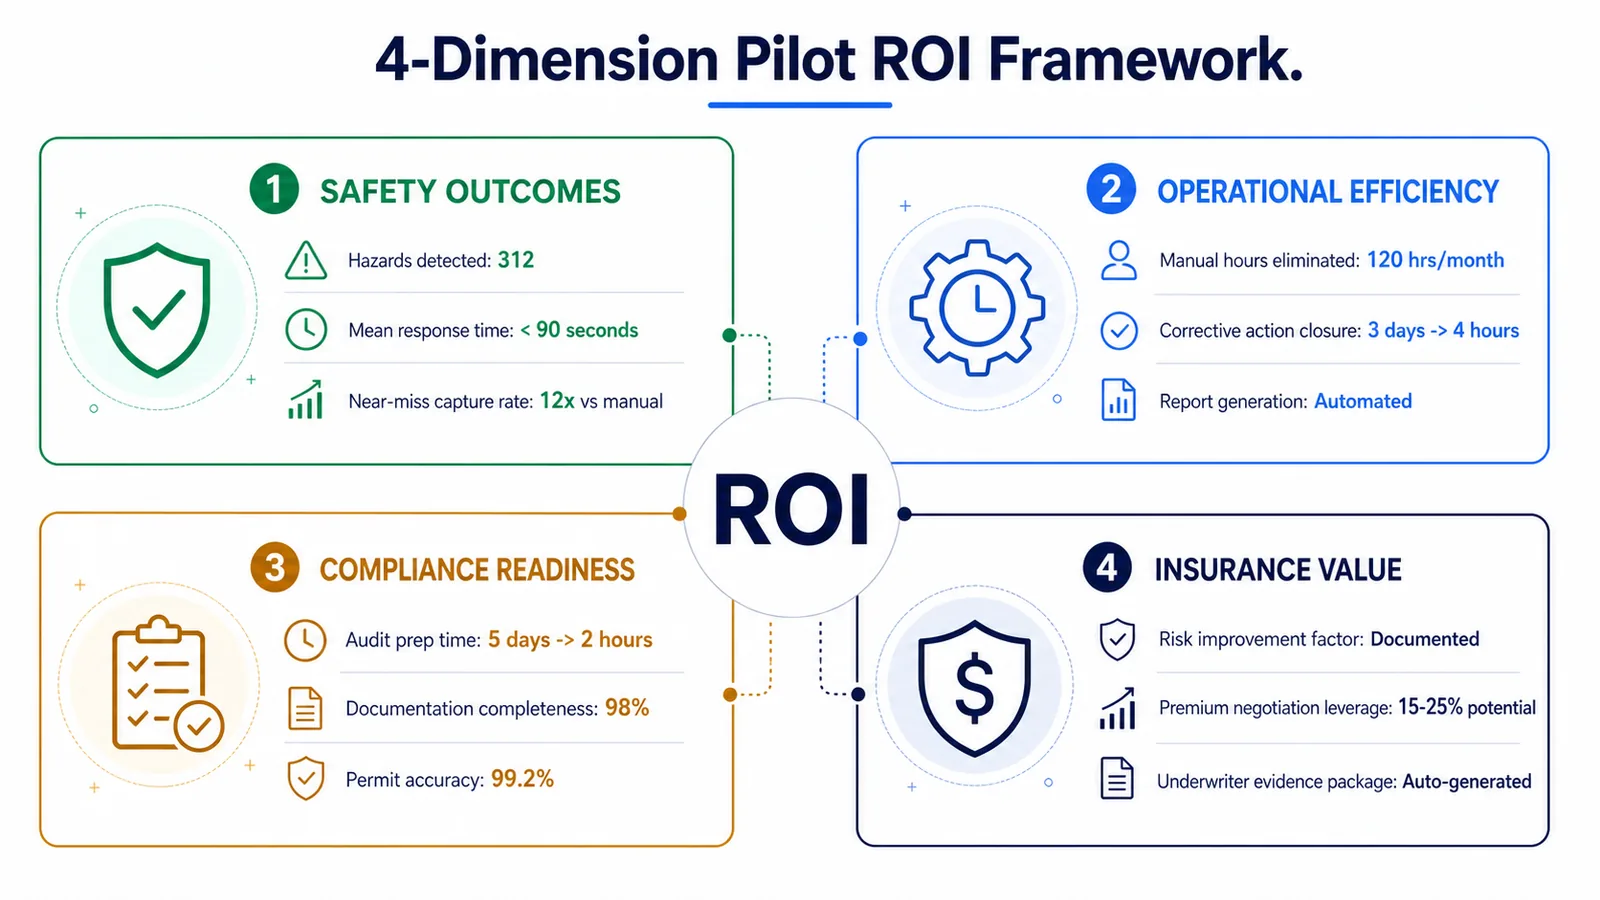
A well-structured safety intelligence pilot should measure ROI across four dimensions: safety outcomes (hazards detected, response times), operational efficiency (manual hours eliminated, workflow automation), compliance readiness (audit trails, permit accuracy), and insurance value (risk improvement documentation for underwriters). Most pilots fail not because the technology underperforms, but because the evaluation framework was undefined before Day 1. This article provides a 30-day measurement methodology designed for CFOs, VP EHS, and Risk Managers who need defensible numbers.
Introduction: Why Pilots Fail to Prove ROI — and How to Fix It
Most safety technology pilot programs end with enthusiasm but no contract. The safety team sees value. But when the CFO asks, "What did this save us?" the room goes quiet.
The problem is rarely the platform. It is the pilot design.
Traditional EHS software ROI evaluations rely on post-implementation surveys and projected incident reductions. That creates two fatal gaps: no baseline (without pre-pilot data, every claim is speculative) and no financial translation (detecting 300 hazards means nothing without cost-per-hazard and time-to-resolution context).
This article presents a 30 day safety software pilot measurement methodology for organizations evaluating a Safety Intelligence Platform like SAFVR AURA. The framework is conservative, financially credible, and produces structured documentation for internal and risk-review conversations.
Who this is for: CFOs evaluating capital allocation, VP EHS preparing board-level business cases, Risk Managers documenting risk improvement for insurance renewals, and Underwriters seeking objective evidence of safety program maturity.
What Should a 30-Day Safety Pilot Actually Measure?
Before configuring cameras, the pilot team must answer: What does success look like in financial terms?
A safety intelligence pilot is a controlled experiment with a measurable hypothesis:
"If we deploy live hazard detection across [X] zones for 30 days, we expect to measure [Y] quantifiable outcomes that translate to [Z] financial value."
Measurement Framework
| Dimension | What to Measure | Financial Translation | Primary Stakeholder |
|---|---|---|---|
| Safety Outcomes | Hazards detected, time-to-detection, coverage hours | Cost of unmitigated incidents, OSHA penalty exposure | VP EHS / Safety Director |
| Operational Efficiency | Manual inspection hours eliminated, alert-to-action time, workflow automation rate | Labor cost reallocation, supervisor productivity | Plant / Operations Leader |
| Compliance Readiness | Audit trail completeness, permit-to-work accuracy, inspection coverage | Regulatory penalty avoidance, audit preparation cost | Compliance / Legal |
| Insurance & Risk | Leading indicator trends, risk score movement, documented improvement | Premium negotiation leverage, deductible reduction | CFO / Risk Manager / Underwriter |
Source: Pilot benchmark framework derived from anonymized SAFVR deployment data across manufacturing, warehousing, and oil & gas operations.
This ensures the evaluation committee has data for every stakeholder — not just the safety team.
The 4-Dimension ROI Model
Dimension 1: Safety Outcomes
SAFVR AURA's AI hazard detection uses existing IP cameras to identify Unsafe Acts & Conditions in real time.
Key pilot metrics:
| Metric | Baseline | Pilot Measurement | Conservative Value |
|---|---|---|---|
| Hazards detected per week | Manual inspection logs | AURA detection count | Customer-reported: 8-15× increase vs. spot inspections |
| Time-to-detection | Supervisor round (2-4 hours) | Seconds to alert | Pilot benchmark: <30 seconds |
| Coverage hours | Shift-based patrols | 24/7 monitoring | Illustrative example: 168 hrs/week vs. 40-60 hrs/week patrol |
| Preventable Risk Events | Near-miss reports (underreported 60-80%) | Automated event log | Third-party statistic: OSHA estimates 70% of incidents preceded by unreported near misses |
Sources: Customer-reported (anonymized deployment data, 2024-2025); pilot benchmark (SAFVR 30-day pilot); third-party statistic (OSHA near-miss methodology).
CFO translation: Every hazard detected before it becomes an incident represents avoided direct and indirect costs. An illustrative example suggests reducing even one recordable incident per quarter can offset the annual platform cost.
Dimension 2: Operational Efficiency
Supervisors spend 25-40% of their time on patrols and paperwork. A safety intelligence pilot should measure time reallocated to higher-value work.
SAFVR AURA's safety compliance automation replaces manual alert chains with trackable workflows.
Key pilot metrics:
| Metric | Baseline | Pilot Target | Financial Translation |
|---|---|---|---|
| Alert-to-assignment time | 15-45 minutes | <2 minutes (automated) | Supervisor hours reallocated to coaching |
| Inspection documentation | 30-60 minutes/shift | Near-zero (auto-generated) | Illustrative example: 5-8 hours/week reclaimed |
| Permit-to-work cycle | 2-4 hours (paper) | 15-30 minutes (digital) | Reduced contractor idle time |
| Follow-up accountability | 40-60% (manual) | 90%+ (closed-loop) | Reduced repeat violations |
Sources: Pilot benchmark (SAFVR deployment data, 2024-2025); illustrative example based on mid-size manufacturing site.
CFO translation: Define the reallocation plan before Day 1 — for example, shifting patrol hours to proactive safety coaching.
Dimension 3: Compliance Readiness
Regulatory audits are expensive even when you pass. AURA generates timestamped, geotagged evidence trails for every detection, creating an audit-ready dataset.
Key metrics: audit trail completeness, permit-to-work accuracy, inspection coverage, and report generation time.
Source: Customer-reported (anonymized deployment data, 2024-2025).
CFO translation: OSHA penalties for serious violations range from $1,191 to $16,131 per violation (2026); willful violations exceed $161,000. Continuous documentation has quantifiable risk-adjusted value.
Dimension 4: Insurance & Underwriting
This is the dimension most safety technology pilot programs ignore — and the one most CFOs care about.
Underwriters want evidence, not narratives. A 30-day pilot generates leading indicator reports, risk score movement, and intervention evidence.
Key pilot metrics:
| Metric | Value to Underwriter | Documentation Output |
|---|---|---|
| Hazard detection rate | Objective safety program maturity | Weekly detection report by category |
| Mean time to resolution (MTTR) | Operational responsiveness | Trend chart showing improvement |
| Risk hotspot heat map | Concentrated risk identification | Geospatial detection density analysis |
| Training completion correlation | Behavioral improvement | Incident-based micro-training rates vs. repeat detection reduction |
Source: Pilot benchmark (SAFVR insurance partnership data, 2024-2025).
CFO translation: Better documentation can support risk-review conversations, but premium outcomes depend on the insurer, policy terms, loss history, and underwriting review. For a manufacturer with $500,000 in annual workers' compensation premiums, any pricing change should be modeled as a scenario, not a guaranteed ROI lever.
Ready to run a pilot with this framework built in? Start your 30-day safety intelligence pilot with SAFVR AURA — existing cameras, dedicated onboarding, and structured ROI measurement included. Schedule a demo first if you want to see the platform before committing.
Week-by-Week Pilot Milestones
A 30 day safety software pilot is structured, not passive.
| Week | Phase | Key Activities | Deliverable |
|---|---|---|---|
| Week 1 | Baseline & Setup | Camera integration, zone mapping, hazard calibration, baseline collection | Baseline Metrics Report |
| Week 2 | Live Detection | AURA activated, real-time alerts begin, responder workflows configured | Live Detection Report |
| Week 3 | Workflow & Action | Automated dispatch active, compliance workflows running, dashboards in use | Action Efficiency Report |
| Week 4 | Analysis & Documentation | Full dataset compiled, 4-dimension ROI calculation, underwriting package prepared | Pilot Summary Report |
Source: Pilot benchmark (SAFVR standard pilot methodology, 2024-2025).
Critical success factor: The Week 1 baseline is non-negotiable. Collect at least 7 days of baseline data before activating detection.
Baseline Metrics: What to Capture Before Day 1
Capture these metrics before the first alert. They form the denominator of every ROI calculation.
Safety & Incident Baseline
- Recordable incident count (last 12 months)
- Near-miss reports filed (last 90 days)
- Manual safety inspections per week
- Supervisor patrol hours per week
- Average time from hazard observation to notification
- PPE violation observations (manual) per week
- Restricted zone breach incidents per quarter
Operational Baseline
- Supervisor FTE allocation (patrol / admin / coaching)
- Permit-to-work cycle time
- Safety alert response time
- Follow-up completion rate (% resolved)
- Safety meeting prep time per week
Compliance Baseline
- Last audit date and findings count
- Outstanding corrective actions count and age
- Documentation completeness score
- Time to generate a compliance report
Financial Baseline
- Annual workers' compensation premium
- Annual cost of recordable incidents
- Safety supervisor labor cost (loaded)
- Estimated OSHA penalty exposure
- Insurance deductible amount
Source: Pilot benchmark checklist (SAFVR pilot onboarding protocol).
Quantifying Detection Value
Most industrial sites have blind spots because human patrols are intermittent.
Coverage Comparison
| Factor | Human Patrol (Typical) | AURA Continuous Monitoring |
|---|---|---|
| Coverage hours/week | 40-60 hours | 168 hours (24/7) |
| Zones covered simultaneously | 1 | Unlimited (all camera-enabled zones) |
| Detection speed | 15 min – 4 hours | <30 seconds |
| Documentation rate | 60-70% | 100% |
Sources: Pilot benchmark (SAFVR deployment data); illustrative example based on 2-supervisor shift pattern.
Translating Detection to Financial Value
Use this conservative formula:
Detection Value = (Hazards Detected × Mitigation Rate × Cost per Unmitigated Hazard) − Platform Cost
Illustrative example: A pilot detects 120 hazards in 30 days. At a 20% progression rate and $3,000 average incident cost: 120 × 80% mitigated × 20% progression × $3,000 = $57,600 gross value.
Source: Illustrative example. Customer-reported progression rates range from 8-25%.
Quantifying Action Value
The second half of AI safety platform ROI is measuring what happens after the alert.
Response Time Compression
| Stage | Manual Process | Automated Workflow (AURA) |
|---|---|---|
| Hazard observed | Next patrol round | Real-time detection |
| Alert dispatched | Phone/radio/walk | Auto-dispatch to responder |
| Action assigned | Verbal, no tracking | Auto-ticket with accountability |
| Resolution logged | End-of-shift paperwork | One-tap closure with evidence |
Source: Pilot benchmark (SAFVR workflow automation metrics, 2024-2025).
Key Action Metrics
- Alert-to-assignment time: Target <2 minutes vs. 15-45 minute baseline
- Assignment-to-resolution time: Track 4-week trend
- Auto-escalation rate: % requiring supervisor intervention
- Repeat hazard rate: Declining rate indicates behavioral improvement
The Underwriting Angle: Risk Improvement Documentation
For CFOs and Risk Managers, the most durable return may come from insurance optimization.
Underwriters want evidence of three things: risk awareness, operational control, and continuous improvement.
A 30-day pilot produces documentation for all three:
| Underwriter Question | Pilot Evidence |
|---|---|
| "How do you identify hazards?" | Continuous detection log with categorization |
| "How fast do you respond?" | MTTR trend chart with week-over-week improvement |
| "Are you preventing repeats?" | Repeat hazard rate vs. training completion |
| "What is your risk trend?" | Detection vs. resolution volume over time |
| "Can you prove it?" | Timestamped video, audit trails, geotagged logs |
Source: Pilot benchmark (SAFVR insurance partnership documentation, 2024-2025).
A safety intelligence pilot with documented improvement gives CFOs three leverage points: premium negotiation, deductible optimization, and coverage expansion.
Source: Illustrative example based on industry-standard underwriting practices. Actual impact varies by carrier and claims history.
Common Pilot Mistakes That Skew ROI
Mistake 1: No Baseline Data
The error: Starting detection without measuring current-state coverage, response times, or hazard reporting. The fix: Capture baseline metrics first. Without a denominator, every numerator is meaningless.
Mistake 2: Measuring Outputs, Not Outcomes
The error: Celebrating "500 alerts sent" without measuring resolution speed or repeat violation reduction. The fix: Define outcome metrics before Week 1. Alerts are outputs; mitigated hazards are outcomes.
Mistake 3: Ignoring Total Cost of Ownership
The error: Calculating ROI using only subscription cost. The fix: Build a three-year TCO including platform fees, admin labor, and training. AURA uses existing cameras, but model ongoing costs for accurate payback period calculation.
Mistake 4: Selecting Non-Representative Zones
The error: Running the pilot in the safest area, then extrapolating site-wide. The fix: Select zones representing actual risk — high-activity, high-hazard, high-traffic areas.
Mistake 5: Ending at Day 30 Without a Decision Framework
The error: Treating Day 30 as a report date, letting the pilot drift with no go/no-go criteria. The fix: Define success criteria before Day 1. What detection volume justifies expansion? What ROI threshold triggers purchase? Put it in writing.
Frequently Asked Questions
What is a safety intelligence pilot?
A safety intelligence pilot is a time-limited, structured evaluation of a Safety Intelligence Platform — typically 30 days — designed to measure quantifiable outcomes across safety, operational, compliance, and financial dimensions before full deployment.
How long should a safety platform pilot run?
Thirty days is the industry standard for a safety technology pilot program focused on detection and response — enough for statistical relevance (typically 500+ events) while remaining lightweight. Extensions to 60-90 days suit behavioral change or insurance impact measurement.
What ROI should we expect from a 30-day safety software pilot?
Most pilot ROI comes from hazard visibility and response acceleration. An illustrative example suggests detecting 100+ hazards in 30 days, with a conservative 10-20% progression rate, represents avoided incident costs that can exceed the annual platform fee. Durable returns materialize over 6-12 months.
Do we need new cameras for a safety intelligence pilot?
No. SAFVR AURA integrates with existing IP camera infrastructure. No rip-and-replace is required. Analog systems typically work with standard IP converters. See our pilot program details for requirements.
How do we document pilot results for insurance underwriters?
Include: (1) hazard detection log with timestamps, (2) response time trends, (3) risk hotspot mapping, and (4) continuous improvement evidence. AURA generates all of this automatically. Learn more about predictive safety intelligence.
Conclusion: From Pilot to Business Case
A safety intelligence pilot should end with a decision — not a deck. This methodology gives CFOs, VP EHS, and Risk Managers the framework to decide with confidence.
The four-dimension ROI model ensures every stakeholder sees relevant value. Week-by-week milestones keep the pilot on track. The baseline checklist eliminates the "we think it worked" problem. Underwriting documentation transforms safety technology from a cost center into a risk-financing asset.
The conservative approach: Start with a 30-day safety intelligence pilot using existing cameras, a defined framework, and a clear decision date.
The faster approach: Schedule a demo to see AURA's detection, workflow automation, and reporting before committing.
See how industrial leaders measured success on our customers page, or explore the full AURA Safety Intelligence Platform.
Related Reading
- How to Evaluate a Safety Intelligence Platform — The 10-capability scorecard to use before you design your pilot.
- What Is a Safety Intelligence Platform? — Foundation reading: how a safety intelligence platform differs from EHS software and why the distinction matters for ROI.
- Predictive Safety Analytics Guide — The predictive analytics layer that drives the “PREVENT” dimension of pilot ROI.