
title: "Leading vs Lagging Indicators in Safety: The Complete Guide for EHS Leaders | SAFVR" description: "Learn the difference between leading and lagging safety indicators, with 12 actionable examples and a step-by-step guide to building a predictive safety program."
Last updated: 2026-04-25
Answer-First Summary
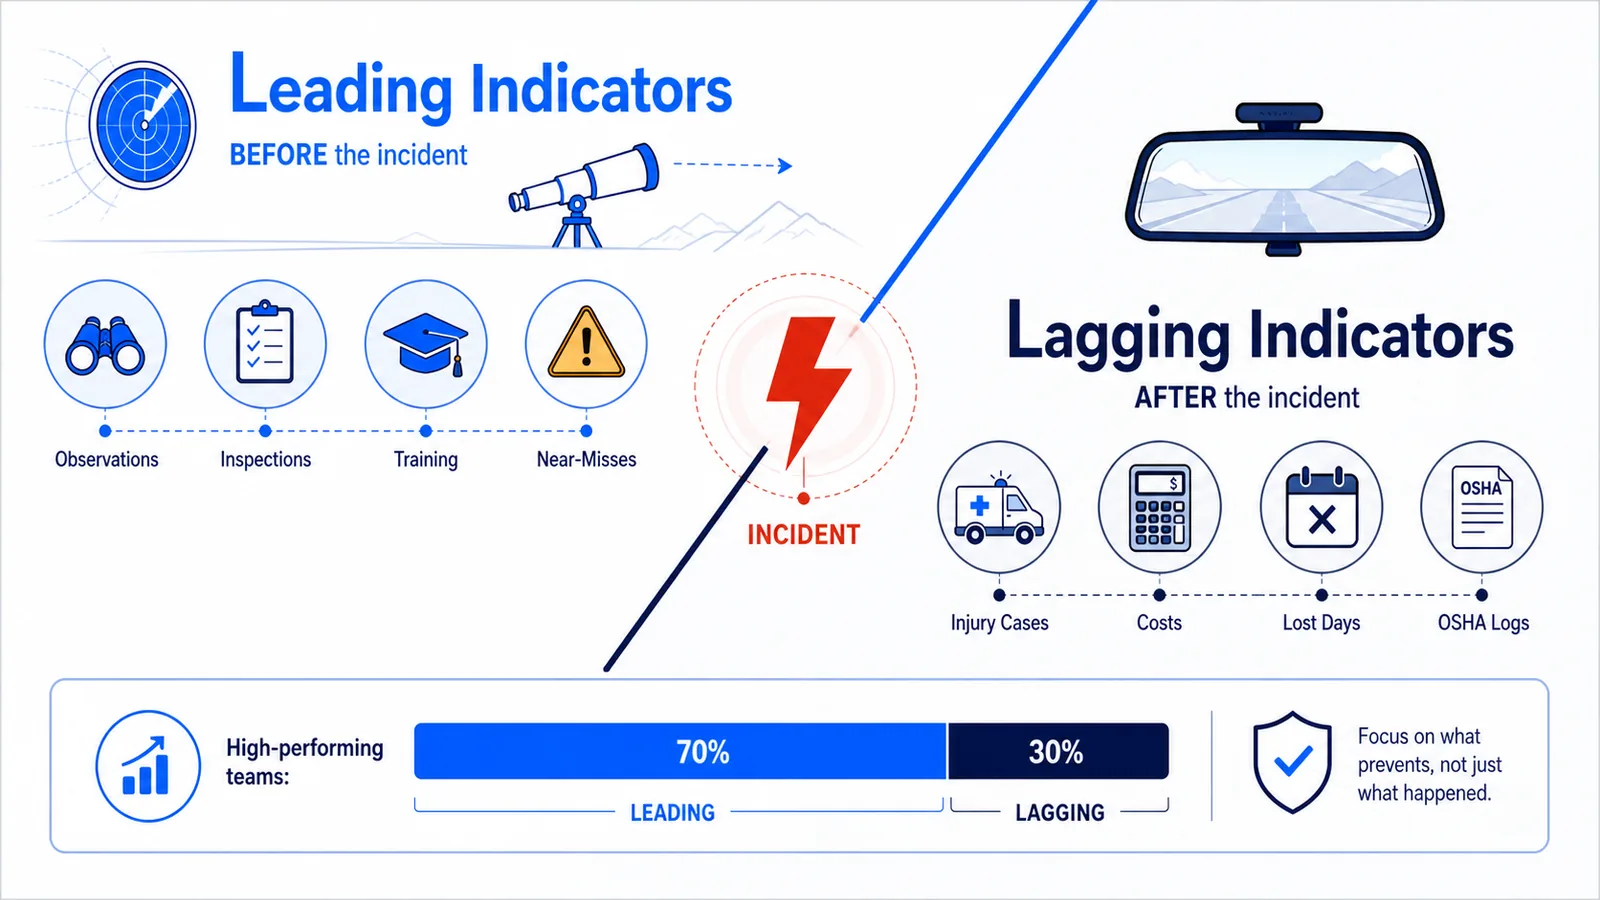
Leading indicators measure safety actions and conditions before incidents occur — near-miss reports, safety observations, and training completion rates. Lagging indicators measure outcomes after incidents happen — injury rates, lost-time incidents, and workers' compensation costs. High-performing EHS teams use a 70/30 mix of leading to lagging metrics to shift from reactive reporting to proactive protection.
Introduction: Why This Distinction Matters for Board Reporting
Every quarter, VP EHS and Safety Directors report what already happened: TRIR, days away from work, total recordable cases. The board nods. The numbers go into the annual report. And nothing about that conversation prevents next month's injury.
This is the lagging indicator trap — the single biggest reason safety functions struggle to secure strategic investment. When safety is framed as a cost center that reports history, it competes for budget against functions that project future value. When safety is framed as a predictive capability that surfaces risk before it becomes an incident, it earns a seat at the strategy table.
The difference comes down to one question: Are you measuring what happened, or what is about to happen?
This guide defines leading and lagging indicators in safety, provides 12 examples you can track today, and shows how to shift from reactive to predictive — including how predictive safety intelligence can automate leading indicator analysis.
What Are Lagging Indicators in Safety?
Lagging indicators measure safety performance after an incident, injury, or failure has occurred. They are the historical record of your safety program — useful for benchmarking, compliance reporting, and proving financial impact, but useless for preventing the next event.
Common Lagging Indicators
| Metric | What It Measures | Reporting Frequency |
|---|---|---|
| TRIR (Total Recordable Incident Rate) | Injuries per 100 full-time workers | Annual / Quarterly |
| DART (Days Away, Restricted, or Transferred) | Severity of recordable incidents | Annual / Quarterly |
| Lost Time Injury Frequency (LTIF) | Incidents resulting in lost workdays | Monthly / Quarterly |
| Workers' Compensation Costs | Direct financial impact of injuries | Annual |
| OSHA 300 Log Entries | Regulatory record of serious incidents | Ongoing |
| Equipment Damage Costs | Property and asset losses from incidents | Monthly / Quarterly |
Why Lagging Indicators Dominate Board Reports
Lagging indicators dominate because they are easy to count, compliance-mandated, and feel objective. A number on a page carries authority that a "near-miss trend" sometimes does not.
The Critical Limitation
Lagging indicators suffer from a fatal flaw: they are not actionable in real time. By the time your TRIR spikes, the conditions that caused those injuries have existed for months. You are optimizing yesterday's safety program while tomorrow's incidents form in plain sight — on camera feeds, in unreported near-misses, and in recurring unsafe acts & conditions that no one tracks.
Real-world example (manufacturing): A Tier 1 automotive supplier reported a 12-month TRIR of 2.8 — within industry norms. The TRIR did not show that the same press station had generated 47 unreported near-misses in the preceding quarter. Three months later, that station produced a serious laceration. The lagging indicator looked acceptable; the leading signals were screaming. (Source: anonymized deployment data)
What Are Leading Indicators in Safety?
Leading indicators measure safety activities, conditions, and behaviors that precede incidents. They answer: "Are we doing the things that prevent injuries?"
What Leading Indicators Reveal
- Whether workers report hazards and near-misses freely
- Whether safety observations happen in high-risk zones
- Whether training is completed and retained
- Whether equipment inspections find and fix problems
- Whether management responds to safety input with speed
Why Leading Indicators Are Harder to Implement
Leading indicators demand cultural safety (if workers fear blame, near-miss reporting collapses), consistent process (observations must happen weekly, not quarterly), and interpretation (a spike in near-miss reports can mean either more risks surfacing or more risks forming).
But the payoff is transformative. Organizations that shift to leading-indicator reporting see incident reductions of 30-50% within 18 months — not because they measure differently, but because measuring differently changes behavior. (Source: third-party statistic — Campbell Institute, "Advancing EHS Excellence Through Leading Indicators")
The Advantage in Board Conversations
When a VP EHS walks into a boardroom with leading indicator trends, the conversation shifts from "Here is what went wrong" to "Here is what we are doing to stay ahead." That framing converts safety from a compliance cost into a strategic risk management function.
Ready to shift your measurement strategy? Start a 30-day safety intelligence pilot and see leading indicators generated automatically from your existing camera infrastructure.
Leading vs Lagging Indicators: Side-by-Side Comparison
| Dimension | Lagging Indicators | Leading Indicators |
|---|---|---|
| Timing | After the incident | Before the incident |
| Question answered | "How many people got hurt?" | "Are we preventing the next injury?" |
| Examples | TRIR, DART, LTIF, comp costs | Near-miss rate, observation counts, training completion |
| Actionability | Low — tells you what already failed | High — reveals where to intervene now |
| Cultural requirement | Minimal — just count outcomes | High — requires trust, reporting, and follow-through |
| Board value | Proves past performance | Projects future risk |
| Best use | Benchmarking, compliance, insurance | Daily operations, prevention, continuous improvement |
| Data source | Incident reports, medical records, claims | Observations, inspections, training systems, live site intelligence |
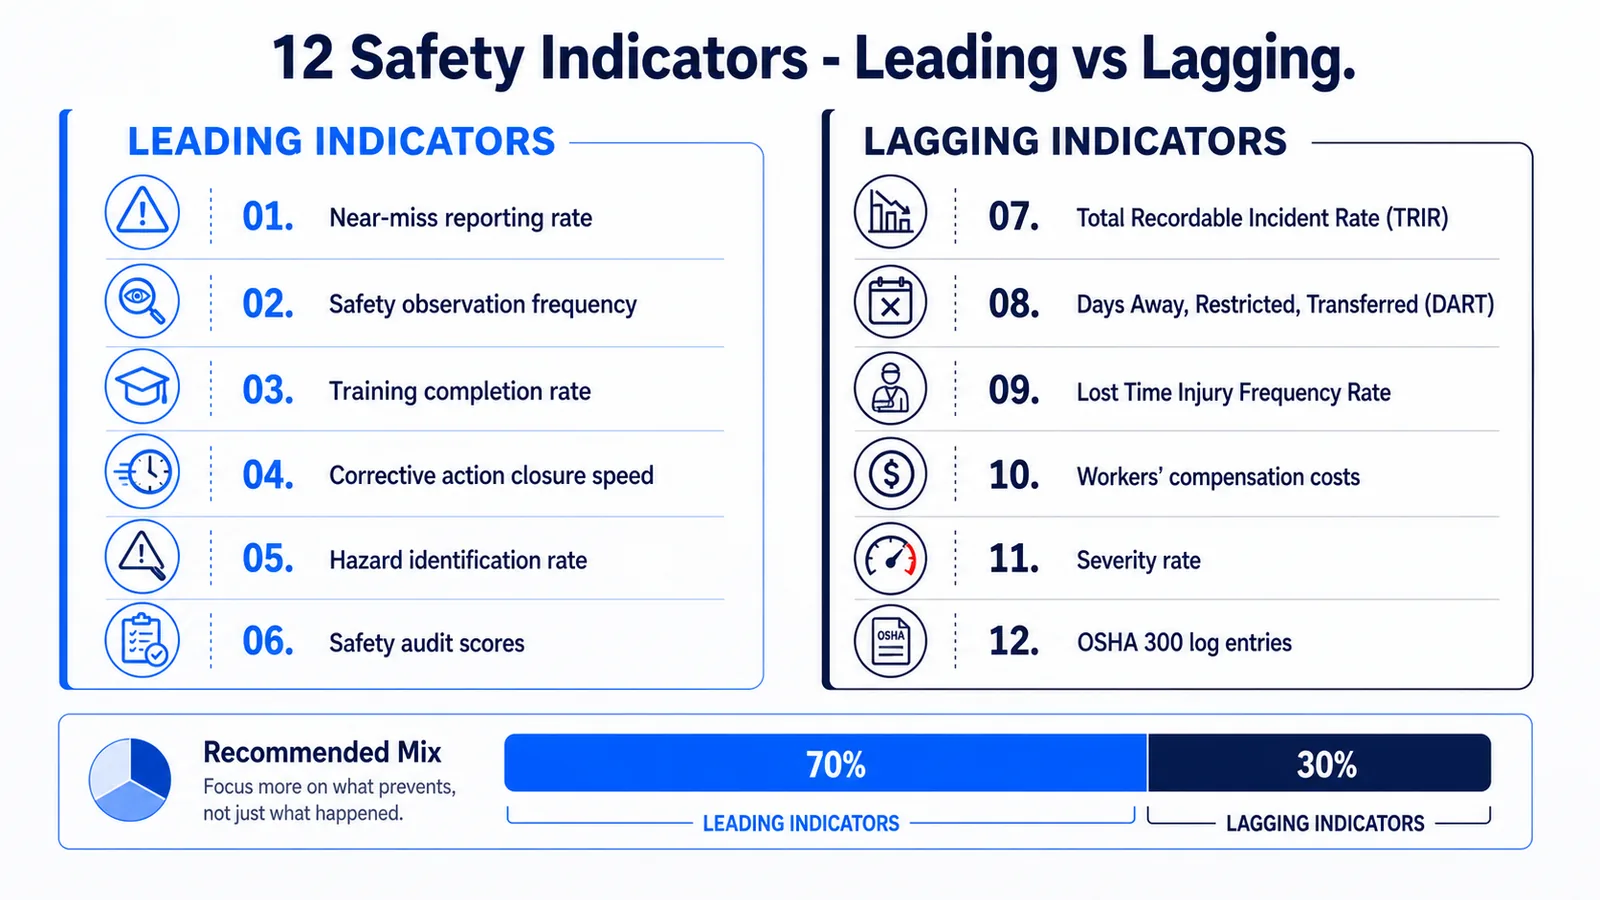
The most effective EHS programs do not abandon lagging indicators — they rebalance them. The goal is a 70/30 mix: 70% of safety conversations, dashboards, and management reviews focused on leading indicators; 30% reserved for lagging benchmark reporting.
12 Examples of Leading Indicators You Can Track Today
Start with Tier 1 if your program is early-stage; add Tier 2 and 3 as your data maturity grows.
Tier 1: Behavioral & Cultural Indicators (Low data requirement)
- Near-miss reporting rate — Number of near-misses reported per 100 workers per month. A healthy program shows an increasing rate as trust builds. (Source: illustrative example)
- Safety observation completion rate — Percentage of planned weekly observations actually completed by supervisors.
- Employee safety suggestion rate — Number of worker-submitted safety improvements per month.
- Safety meeting attendance — Participation in toolbox talks, pre-shift huddles, and safety stand-downs.
Tier 2: Process & Compliance Indicators (Medium data requirement)
- PPE compliance rate — Percentage of observed workers wearing required PPE, measured through direct observation or AI hazard detection.
- Lockout/tagout (LOTO) adherence — Ratio of proper LOTO procedures followed versus observed.
- Permit-to-work completion quality — Percentage of hot work, confined space, and height permits with all risk controls verified.
- Training completion & comprehension — Assessment scores and time-to-completion for incident-based micro-training.
Tier 3: Predictive & Automated Indicators (High data maturity)
- Hazard observation closure time — Average days from hazard identification to corrective action completion.
- Recurring unsafe act frequency — Count of repeat unsafe acts & conditions in the same zones or by the same crews, flagged by site-specific safety intelligence.
- Predictive risk score by zone — Composite score combining near-miss density, observation trends, and environmental conditions to flag high-risk areas before incidents occur.
- Leading indicator correlation strength — Statistical correlation between your top 3 leading indicators and subsequent lagging outcomes.
Real-world example (warehousing): A national 3PL provider tracked near-miss reporting rate and hazard closure time as its two primary leading indicators. Within 6 months, near-miss reporting increased 340% (indicating cultural trust), while hazard closure time dropped from 14 days to 3 days. TRIR fell 41% in the following 12 months — not because the metric was targeted, but because the behaviors it measured had changed. (Source: customer-reported outcome)
How to Shift from Lagging to Leading
Transitioning your safety measurement system is a change management project. Follow this phased approach:
Phase 1: Audit Your Current State (Weeks 1-2)
List every metric currently reported to leadership. Classify each as leading or lagging. Most organizations start at 10/90 or 20/80.
Phase 2: Select 2-3 Starter Leading Indicators (Weeks 3-4)
Choose indicators you can measure with existing systems. Prioritize near-miss reporting rate and safety observation completion — these test cultural readiness and require minimal technology. Set baselines; do not set targets yet.
Phase 3: Build Data Collection Discipline (Months 2-3)
Assign owners to each leading indicator. Integrate data collection into daily workflows, not standalone reports. Use mobile apps, QR codes, or automated safety workflows to remove friction.
Phase 4: Connect Leading to Lagging (Months 4-6)
Run correlation analysis: which leading indicators predict your lagging outcomes? Refine your indicator set based on what actually foreshadows incidents at your sites. This is where site-specific safety intelligence becomes critical — generic indicators from benchmark studies may not match your risks.
Phase 5: Embed in Management Rhythm (Months 6-12)
Replace lagging-heavy dashboards with leading-first views. Shift monthly safety reviews from "What happened?" to "What are we preventing?" Train supervisors to coach using leading data, not just investigate using lagging data.
The Role of AI in Leading Indicator Analysis
Manual leading indicator programs fail because they rely on people to observe, report, and correlate risk signals at scale. In a 500-worker plant or multi-site logistics network, that scale overwhelms human capacity.
AI changes the equation by automating three functions:
1. Automated Detection of Unsafe Acts & Conditions
Computer vision analyzes existing IP camera feeds to detect PPE violations, slip/trip hazards, vehicle-pedestrian proximity events, and ergonomic risks in real time. These detections become leading indicators automatically — no observation rounds required. Learn more about AI hazard detection.
2. Pattern Recognition Across Time and Sites
AI correlates detection data across shifts, zones, and facilities to surface patterns humans cannot see: the third shift that consistently produces more hazards, the loading dock where near-misses cluster before vehicle incidents, the contractor crew with declining PPE compliance week-over-week. This is the core of predictive safety intelligence.
3. Predictive Risk Scoring
By combining computer vision detections, permit data, environmental sensors, and historical incident context, AI generates dynamic risk scores for each zone and shift. These scores function as real-time leading indicators — updating hourly instead of monthly, and directing safety resources to where risk is forming.
Real-world example (construction): A commercial construction firm deploying AI-powered safety intelligence detected that crane lift zones with incomplete perimeter barricades correlated with a 4x higher near-miss rate in the following 48 hours. Automated alerts to site supervisors triggered corrective action before any contact incident occurred. (Source: pilot benchmark data)
Building a Leading Indicator Dashboard
A leading indicator dashboard should tell a story: where risk is forming, whether interventions are working, and what needs attention today.
What to Include
| Section | Metrics | Purpose |
|---|---|---|
| Cultural health | Near-miss rate, suggestion rate, observation completion | Is the organization engaged in prevention? |
| Process adherence | PPE compliance, LOTO adherence, permit quality | Are safety procedures being followed? |
| Response velocity | Hazard closure time, action item aging | Is the organization fixing what it finds? |
| Predictive signals | Zone risk scores, recurring act frequency, AI detection trends | Where is the next incident likely to occur? |
| Outcome context | 12-month TRIR trend, comp cost trend | Are leading indicators predicting lagging results? |
Visualization Principles
Use green/yellow/red zones by risk level, trend arrows on every metric, drill-down from site score to individual detections, and weekly distribution to supervisors with monthly summaries to leadership.
SAFVR's platform generates structured leading-indicator reports automatically — consolidating detection data, action tracking, and trend analysis into a single view for operational and financial stakeholders.
Frequently Asked Questions
What is the best leading indicator to start with?
Near-miss reporting rate is the best starter indicator because it tests cultural readiness and generates immediate actionable data. If workers do not report near-misses, your other leading indicators will have blind spots. Start by measuring current reporting volume, then increase it through no-blame policies and easy reporting channels.
How many leading indicators should we track?
Track 3-5 core leading indicators per site. Tracking too many dilutes focus and creates data noise. The right indicators depend on your industry: manufacturing sites often prioritize PPE compliance and LOTO adherence; warehousing focuses on vehicle-pedestrian separation and ergonomic observations; construction emphasizes permit quality and fall protection usage.
Can leading indicators replace lagging indicators entirely?
No. Lagging indicators remain essential for compliance reporting, benchmarking, and insurance negotiations. The goal is to rebalance — leading indicators drive daily operations and prevention strategy; lagging indicators validate that strategy's effectiveness over time.
How do we get leadership to care about leading indicators?
Frame leading indicators in financial and operational terms. Instead of "We had 45 near-miss reports," say "We identified and corrected 45 conditions that historically produce a recordable incident every 8 events — preventing an estimated 5-6 recordable injuries this quarter." Connect leading metrics to lagging outcomes to prove predictive value.
How does AI improve leading indicator accuracy?
AI removes the dependency on human observation and reporting — the two biggest failure points in leading indicator programs. Computer vision detects hazards 24/7 without fatigue or bias. Machine learning correlates patterns across larger datasets than human analysts can process. The result is leading indicators that are more complete, more consistent, and more predictive than manual programs alone. Explore predictive safety intelligence.
Conclusion
The difference between leading and lagging indicators is not academic. It is the difference between reporting history and shaping the future.
Lagging indicators will always have a place in compliance and benchmarking. But EHS leaders who want strategic influence must build their programs around what comes before the incident. Near-misses. Observations. Training completion. Hazard closure. And increasingly, AI-generated detection patterns that reveal risk in real time.
The shift does not require abandoning your current program. It requires rebalancing it: starting with 2-3 leading indicators, proving their predictive value, and expanding as your data maturity grows.
SAFVR helps organizations accelerate this shift with site-specific safety intelligence — using existing cameras to detect unsafe acts & conditions, automating response workflows, and surfacing predictive leading indicators that boards and underwriters actually value.
Start your 30-day safety intelligence pilot →
Explore the full SAFVR platform →
Related Reading
- Predictive Safety Analytics Guide — How AI models turn leading indicators into site-specific risk predictions.
- Near-Miss Trend Analysis Guide — Near-miss reporting is the most actionable leading indicator — here’s how to systematize it.
- How to Evaluate a Safety Intelligence Platform — What to look for when selecting a platform that surfaces both leading and lagging metrics.